Избранное трейдера Андрей из Сибири
Скачиваем исторические данные с tradingview
- 09 мая 2019, 15:32
- |
Алгоритм следующий:
1) Заходим в график tradingview, выбираем инструмент и таймфрейм
2) Нажимаем опубликовать, заполняем обязательные поля
3) Нажимаем на замочек в нижнем правом углу, чтобы идея стала приватной и публикуем
4) Получаем ссылку вида https://ru.tradingview.com/chart/VIX/veShLNLq-vix/
5) Вставляем эту ссылку в php скрипт, который можно скачать здесь https://gist.github.com/AphelionDH/ef168f9bcff907245907db07d92004b0
6) Запускаем скрипт
7) ???
8) Profit
- комментировать
- ★41
- Комментарии ( 26 )
Как же отразить сумму переходящего убытка в новой форме декларации 3-НДФЛ?
- 23 апреля 2019, 10:13
- |
Всем доброго дня!
Давно не писала ничего, сейчас (как мы знаем) идет горячая пора по декларированию доходов за 2018 год. Срочные консультации – пишите сразу на почту (адрес указан в моем аккаунте).
Итак, один из самых главных вопросов, который волнует сейчас налогоплательщиков – это как же увидеть и отразить переходящий убыток, если форма декларации изменилась и теперь его не видно?
Я советую всем, делаю так своим клиентам – оформляю пояснительную записку к налоговой декларации, где вручную расписываю сумму налоговой базы по кодам дохода, указываю сумму убытка и рассчитываю сумму убытка, которая идет в расчет 2018 года, а потом вывожу остаток переходящий на будущие годы. Таким образом фиксирую и для себя, и для налоговиков в будущем.
Давайте на примере: у вас в 2018 году была получена прибыль по «1530» акции = 620 000 рублей и с нее удержали налог 80 600 рублей. По второму российскому брокеру у вас был получен убыток в 2018 году по коду «1532» (пусть это будут опционы на акции) в размере 850 000 рублей. И пускай еще был получен убыток за 2016 год по акциям 20 000 рублей.
( Читать дальше )
3-Ндфл не могу учесть убыток прошлого года .
- 21 апреля 2019, 18:10
- |
Всем здравствуйте Приближается отчетный период, пытаюсь заполнить декларацию, почти все получилось: основная деятельность, продажа машины, даже зубы импланты внес. А вот с инвестициями какая-то запара. То ли дело когда убытки, один плюс, не надо париться с налогами.
Ситуация такая срочный рынок, в 2018 получена прибыль, брокер начислил налог 22000 рублей и удержал. Мне надо учесть убыток 2017 года чтобы налог вернули. Мои действия таковы: взял у брокера справку о доходах и суммах налога . В доходную часть декларации вношу сумму дохода по коду дохода, и там же вношу вычеты также по имеющемуся коду вычета для этого дохода, но потом появляется пустая графа без дохода с вычетом 209, и куда его вносить непонятно. Графа 209 я так понял относится к предыдущему доходу, у которого два вычета 206 и 209 но в декларационном поле только один вычет 206 так куда же писать 209? Также есть графа сумма удержанного налога и я ее заполнил 22000р. Далее вхожу в раздел вычеты, инвестиционные убытки по ЦБ, в разделе Убытки прошлых лет, убытки по операциям с ПФИ. Из другой справки за 2017г. от брокера у меня убыток 52000.Заношу ее туда и получается, что я еще должен. А если в эту графу внести суммированный вычет 209, то все получается в 0 т.е. нет возврата.
В общем 2 вопроса: куда вписывать вычет 209 и куда вписывать убытки прошлых лет.
Судак-Тудак (робот)
- 18 апреля 2019, 15:32
- |
Алгоритм данной торговли был описан уважаемым Гном (https://smart-lab.ru/blog/499606.php) и, поскольку я являюсь любителем различных теорий Мартингейла и усреднения, написал робота по этой стратегии.
Подробно на алгоритме останавливаться не буду — читайте по ссылке у Гнома, там очень хорошо всё расписано.
Здесь — немного измененная реализация. Отличие в том, что позиции открываются не через равные промежутки цены, а чуть шире: еще должно прийти хотя бы минимальное подтверждение, что дальше не полетит (в данном случае использован вход обратно в канал Боллинджера, но это несложно поменять на что угодно).
Если полетит против нас вертикально, мы хотя бы не будет бессмысленно открывать кучу сделок на мгновенной длинной вертикальной палке.
Итак, представляю: «Судак-Тудак» Универсальный (одновременно для акций и фьючерсов).
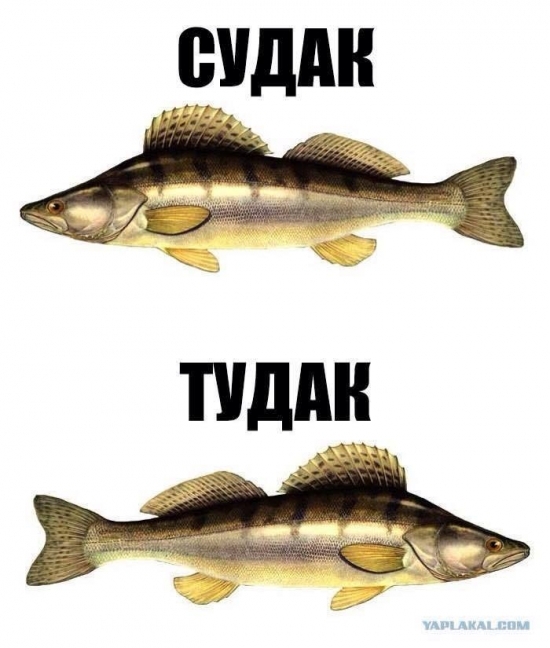
Если хотите добавить инструменты (а они добавляются в массив aTickerList), не забудьте вписать их данные в массивы:
( Читать дальше )
Инструкция: Подаем налог по зарубежному счету
- 15 апреля 2019, 23:00
- |
На выходных заполнял декларацию и решил заодно написать инструкцию как подавать 3-НДФЛ по зарубежному счету.
В отличие от российских счетов, где брокеры выступают налоговыми агентами, по зарубежному счету инвестор обязан подавать налог самостоятельно, заполняя 3-НДФЛ и подавая ее в налоговую до 30 апреля.
В дополнение к инструкции написал немного про то, как следует выбирать зарубежного брокера и привел несколько лайфхаков/своих файлов, которые помогут вам сэкономить на подаче декларации.
1) Смотрите на комиссии и покрытие зарубежных рынков (в идеале не только США, но и LSE/Азию, где обращаются некоторые российские компании). Помните про комиссию вашего банка за перевод за рубеж.
2) Обязательно — наличие лицензии SIPC. (это вещь как российское АСВ, я бы не понес деньги в банк, который не участвует в системе страхование вкладов)
3) Обратите внимание чтобы у брокера не было «банковского функционала», тогда вам не надо уведомлять об открытии такого счета налоговую и отчитываться особым образом.
( Читать дальше )
Доработал zigzag5
- 08 апреля 2019, 23:49
- |
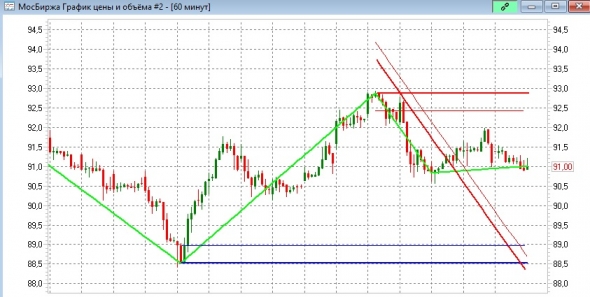
код индикатора:
Settings=
        {
            Name = "Zigzag5",   -- название индикатора
            delta=2,                  -- параметр индикатора
            deltaY=1,                  -- параметр индикатора
            linedeltaY=0.75,                  -- параметр индикатора
            line=
                {
                    {
                        Name = "zigzagline3",
                        Type =TYPE_LINE,
                        Width = 2,
                        Color = RGB(0,255, 0)
                    },
                    {
                        Name = "upline",
                        Type =TYPE_LINE,
                        Width = 2,
                        Color = RGB(255,0, 0)
                    },
                    {
                        Name = "lowline",
                        Type =TYPE_LINE,
                        Width = 2,
                        Color = RGB(0,0, 255)
                    },
                    {
                        Name = "declineline",
                        Type =TYPE_LINE,
                        Width = 2,
                        Color = RGB(255,0, 0)
                    },
                    {
                        Name = "upline2",
                        Type =TYPE_LINE,
                        Width = 1,
                        Color = RGB(255,0, 0)
                    },
                    {
                        Name = "lowline2",
                        Type =TYPE_LINE,
                        Width = 1,
                        Color = RGB(0,0, 255)
                    },
                    {
                        Name = "declineline2",
                        Type =TYPE_LINE,
                        Width = 1,
                        Color = RGB(255,0, 0)
                    }
                }
       }


function getradius(x, y)
  return math.sqrt(Settings.deltaY*y*y+x*x)
end

function koef(val)
  return 1 - 1/(1-1/val)
end


function Init()

  vMin = 0
  vMax = 0
  vMinindex = 0
  vMaxindex = 0
  voldMinindex = 0
  voldMaxindex = 0
  upval = 0
  lowval = 0
  upindex = 1
  lowindex = 1
  veu = nil
  vel = nil
  curfrom = 1
  curto = 1

  return 7
end


function OnCalculate(index)
  local printz = 0
  vsize = Size()

  ve = nil
  veu = nil
  vel = nil
  curv = nil
  veu2 = nil
  vel2 = nil
  curv2 = nil

  if index == 1 then
    vMin = C(index)
    vMax = C(index)
    vMinindex = index
    vMaxindex = index
    voldMinindex = index
    voldMaxindex = index
    ve = C(index)

  else

    if voldMaxindex >= voldMinindex then


	  if C(index) > (1 + Settings.delta/100)*vMin then

        vMin = C(index)
        vMax = C(index)
        vMaxindex = index
        voldMinindex = vMinindex
        vFrom = voldMaxindex
        vTo = vMinindex
        printz = 1

        if (C(vMinindex) > C(vsize)) and (upval > koef(getradius(vsize - vMinindex, C(vMinindex) - C(vsize)))) then
		  upval = koef(getradius(vsize - vMinindex, C(vMinindex) - C(vsize)))
		  upindex = vMinindex
		end
        if (C(vMinindex) < C(vsize)) and (lowval > koef(getradius(vsize - vMinindex, C(vMinindex) - C(vsize)))) then
		  lowval = koef(getradius(vsize - vMinindex, C(vMinindex) - C(vsize)))
		  lowindex = vMinindex
	   end

	    curfrom = voldMaxindex
	    curto = voldMinindex

      else

        if vMin > C(index) then
          vMin = C(index)
          vMinindex = index
          vFrom = voldMaxindex
          vTo = index
          printz = 0
		  curto = index
        else
          vFrom = vMinindex
          vTo = index
          printz = 0
        end

	    curfrom = voldMaxindex

      end


    else

    if voldMaxindex <= voldMinindex then

      if C(index) < (1 - Settings.delta/100)*vMax then

        vMax = C(index)
        vMin = C(index)
        vMinindex = index
        voldMaxindex = vMaxindex
        vFrom = voldMinindex
        vTo = vMaxindex
        printz = 1

        if (C(vMaxindex) > C(vsize)) and (upval > koef(getradius(vsize - vMaxindex, C(vMaxindex) - C(vsize)))) then
		  upval = koef(getradius(vsize - vMaxindex, C(vMaxindex) - C(vsize)))
		  upindex = vMaxindex
		end
        if (C(vMaxindex) < C(vsize)) and (lowval > koef(getradius(vsize - vMaxindex, C(vMaxindex) - C(vsize)))) then
		  lowval = koef(getradius(vsize - vMaxindex, C(vMaxindex) - C(vsize)))
		  lowindex = vMaxindex
		end

	    curfrom = voldMinindex
	    curto = voldMaxindex

      else

        if vMax < C(index) then
          vMax = C(index)
          vMaxindex = index
          vFrom = voldMinindex
          vTo = index
          printz = 0
		  curto = index
        else
          vFrom = vMaxindex
          vTo = index
          printz = 0
        end

	    curfrom = voldMinindex

      end


    end
    end

    if (printz == 1) or (Size() == index) then
      for i = vFrom, vTo do
        k = (C(vTo)- C(vFrom))/(vTo- vFrom)
        v = i*k + C(vTo) - vTo*k
        SetValue(i, 1, v)
        ve = v
      end
      if (Size() == index) then
        ve = C(index)
        if voldMaxindex >= voldMinindex then
          vFrom = voldMaxindex
          vTo = vMinindex
        end
        if voldMaxindex <= voldMinindex then
          vFrom = voldMinindex
          vTo = vMaxindex
        end
        for i = vFrom, vTo do
          k = (C(vTo)- C(vFrom))/(vTo- vFrom)
          v = i*k + C(vTo) - vTo*k
          SetValue(i, 1, v)
        end

        -- up level line
        if upindex ~= nil then
		  if C(upindex) > C(index) then
            for i = upindex, index do
              SetValue(i, 2, C(upindex))
              SetValue(i, 5, C(upindex)-Settings.linedeltaY*C(vsize)/100)
            end
            veu = C(upindex)
          end
		end

		-- low level line
		if lowindex ~= nil then
		  if C(lowindex) < C(index) then
            for i = lowindex, index do
              SetValue(i, 3, C(lowindex))
              SetValue(i, 6, C(lowindex)+Settings.linedeltaY*C(vsize)/100)
            end
            vel = C(lowindex)
         end
       end

       if voldMaxindex >= voldMinindex then
	    vsign = -1
		if curfrom == voldMinindex then
		  vsign = -1
		end
		if curfrom == voldMaxindex then
		  vsign = 1
		end

        -- inclined line
	    if curto- curfrom > 0 then
	     maxcurv = 0
	     k = (C(curto)- C(curfrom))/(curto- curfrom)
         for i = curfrom, curto  do
          curv = i*k + C(curto) - curto*k
          if vsign == -1 then
 		    if L(i) < curv then
		      if maxcurv < curv - L(i) then
		        maxcurv = curv - L(i)
              end
            end
		  else
 		    if H(i) > curv then
		      if maxcurv < H(i) - curv then
		        maxcurv = H(i) - curv
              end
            end
		  end
         end
         for i = curfrom, index  do
          curv = i*k + C(curto) - curto*k + vsign*maxcurv
          SetValue(i, 4,curv)
		  curv2 = curv+ vsign*Settings.linedeltaY*C(vsize)/100
		  SetValue(i, 7,curv2)
         end
	    end
	    curv = nil
	   end

       if voldMaxindex <= voldMinindex then
	    vsign = -1
		if curfrom == voldMaxindex then
		  vsign = 1
		end
		if curfrom == voldMinindex then
		  vsign = -1
		end

        -- inclined line
        if curto- curfrom > 0 then
         maxcurv = 0
         k = (C(curto)- C(curfrom))/(curto- curfrom)
         for i = curfrom, curto  do
          curv = i*k + C(curto) - curto*k
          if vsign == -1 then
 		    if L(i) < curv then
		      if maxcurv < curv - L(i) then
		        maxcurv = curv - L(i)
              end
            end
		  else
 		    if H(i) > curv then
		      if maxcurv < H(i) - curv then
		        maxcurv = H(i) - curv
              end
            end
		  end
         end
         for i = curfrom, index  do
          k = (C(curto)- C(curfrom))/(curto- curfrom)
          curv = i*k + C(curto) - curto*k + vsign*maxcurv
          SetValue(i, 4,curv)
		  curv2 = curv+ vsign*Settings.linedeltaY*C(vsize)/100
		  SetValue(i, 7,curv2)
         end
        end
	    curv = nil
       end

      end
    end

  end

  return ve, veu, vel, curv, veu2, vel2, curv2

endzigzag5 переработал алгоритм горизонтальных уровней
- 06 апреля 2019, 20:19
- |
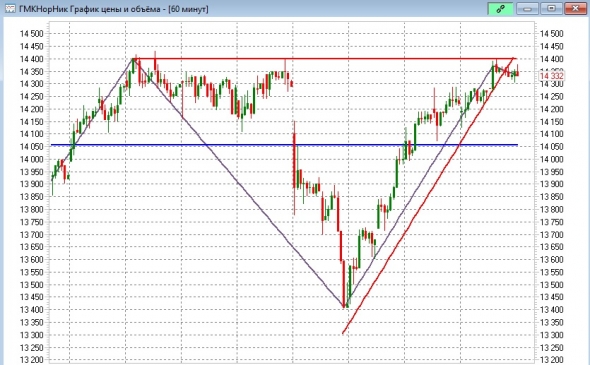
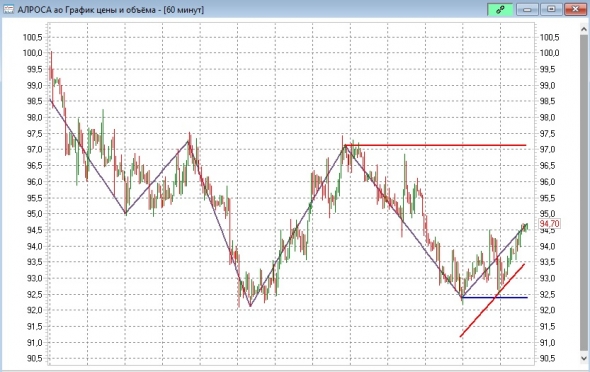
( Читать дальше )
Индикатор ожидаемого движения для опционной торговли (Часть 2 устройство индикатора)
- 05 апреля 2019, 11:25
- |
В первой части мы рассмотрели «теорему о средней волатильности» где, обозначили такое свойство:волатильности могут на разных таймфреймах значительно отличаться друг от друга. Но они всегда будут со временем сходится к одному значению.
Вот, на этом свойстве и будет построен индикатор. Для индикатора нам нужны волатильности на различных таймфреймах. В качестве индикатора волатильности берутся два стандартных индикатора, но которые по сущности показывают одно и тоже.
Price Channel (PC) или ценовой канал. Индикатор представляет из себя две линии, которые ограничивают канал колебаний цены. Верхняя граница канала обозначает уровень локального максимума за прошедшие N периодов, а нижняя граница – уровень локального минимума за тот же промежуток времени. Таким образом, цена ограничивается максимальными точками колебаний – экстремумами за N периодов.
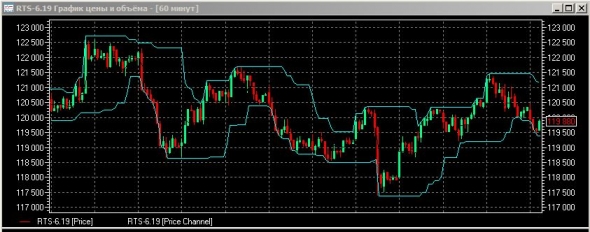
( Читать дальше )
STATDIVPROF индикатор с эквити
- 29 марта 2019, 21:58
- |
если поставить параметр showprof=1, если showprof=0, то будет показывать профит иначе сам индикатор
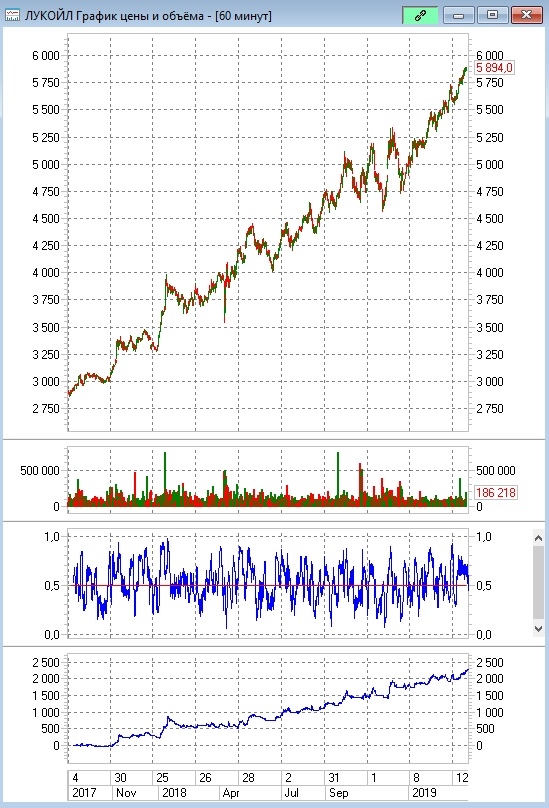
код индикатора
Settings={
Name="STATDIVPROF",
period=30,
showprof=0,
  line=
  {
    {
      Name="curve",
      Color=RGB(0,0,255),
      Type=TYPE_LINE,
      Width=1
    },
    {
      Name="line",
      Color=RGB(255,0,0),
      Type=TYPE_LINE,
      Width=1
    }
  }
}

function Init()
  prof=0
  bp=0
  prevval=0
  return 2
end

function OnCalculate(index)
  local sum1=0
  local sum2=0
  local j=0
  local dprof=0

  if index < Settings.period then
    return nil, nil
  else
    for i=index-Settings.period+1, index do
	  j = j + 1
      if C(i) > O(i) then
        sum1 = sum1 + (C(i) - O(i))*V(i)*j
        sum2 = sum2 + (C(i) - O(i))*V(i)*j
      else
        sum2 = sum2 + (O(i) - C(i))*V(i)*j
      end
    end
    sum1 = sum1/sum2
  end

  if index > Settings.period+1 then

    if prevval < 0.5 and sum1 >= 0.5 then
      bp=C(index)
	end
    if prevval > 0.5 and sum1 <= 0.5 then
      if bp ~= 0 then
	    prof=prof+C(index)-bp
		bp=0
	  end
	end
	if bp ~= 0 then
	  dprof = C(index) - bp
	else
	  dprof = 0
	end

  end
  prevval=sum1

  if Settings.showprof == 0 then
    return sum1, 0.5
  end

  if Settings.showprof == 1 then
    return prof+dprof, nil
  end

endКак инвестировать в облигации?
- 29 марта 2019, 10:22
- |
Нет ничего плохого в том, чтобы быть «ничего — незнающим» инвестором, если Вы это осознаёте. Проблема — это когда Вы «ничего — незнающий» инвестор, а думаете, что что-то знаете.
У. Баффет
Когда мы делаем первые шаги на рынке ценных бумаг, мы начинаем находить инструменты, которые были бы нам наиболее понятны, «ближе» к традиционным инструментам, например, как вклад в банке. По вкладу понятна процентная ставка, гарантия от АСВ и прочее, но зачастую страдает доходность, поэтому мы приходим к такому финансовому инструменту, как облигация.
1. Что такое облигация?
Облигация – это договор займа, в котором одна сторона, «Заёмщик» (Эмитент), занимает деньги под определенный процент у другой стороны, «Кредитора» (Инвестор) и гарантирует, что вернет эти деньги к концу срока договора. Эмитентом может стать не каждый, а вот инвестором может быть любой человек, у кого открыт брокерский счет с доступом на Биржу и имеет хотя бы 1 000 рублей для покупки одной облигации.
( Читать дальше )
- bitcoin
- brent
- eurusd
- forex
- gbpusd
- gold
- imoex
- ipo
- nasdaq
- nyse
- rts
- s&p500
- si
- usdrub
- wti
- акции
- алготрейдинг
- алроса
- аналитика
- аэрофлот
- банки
- биржа
- биткоин
- брокеры
- валюта
- вдо
- волновой анализ
- волны эллиотта
- вопрос
- втб
- газ
- газпром
- гмк норникель
- дивиденды
- доллар
- доллар рубль
- евро
- золото
- инвестиции
- индекс мб
- инфляция
- китай
- кризис
- криптовалюта
- лукойл
- магнит
- ммвб
- мобильный пост
- мосбиржа
- московская биржа
- мтс
- нефть
- новатэк
- новости
- обзор рынка
- облигации
- опрос
- опционы
- отчеты мсфо
- офз
- оффтоп
- прогноз
- прогноз по акциям
- путин
- раскрытие информации
- ри
- роснефть
- россия
- ртс
- рубль
- рынки
- рынок
- санкции
- сбер
- сбербанк
- северсталь
- си
- сигналы
- смартлаб
- сущфакты
- сша
- технический анализ
- торговля
- торговые роботы
- торговые сигналы
- трамп
- трейдинг
- украина
- фондовый рынок
- форекс
- фрс
- фьючерс
- фьючерс mix
- фьючерс ртс
- фьючерсы
- цб
- цб рф
- экономика
- юмор
- яндекс


 Новости тг-канал
