Dow Jones Industrial
Появление фильмов ужасов.
- 18 ноября 2024, 20:32
- |

Жанр ужасов имеет богатую историю, которая охватывает столетия фольклора, устных преданий и литературы. Мэри Шелли, Эдгар Аллан По, Г. Ф. Лавкрафт и другие авторы создали образы чудовищ, которые впоследствии оживут на экране в киноадаптациях.
Первый фильм ужасов, существование которого подтверждено документально, вышел в 1896 году. Режиссёром был известный французский мастер спецэффектов Жорж Мельес, а его работа называлась «Le Manoir du Diable» («Дом дьявола»).
В фильме присутствовали такие элементы, как животные, способные менять форму, плащи-невидимки и женская фигура, которая парила в воздухе и появилась из дымящейся цистерны. Эти визуальные эффекты сильно впечатлили зрителей.
Статья The New York Film Academy от 21 июля 2022 года.
Трёхминутный фильм насыщен образами: в нём есть котлы, анимированные скелеты, призраки, превращающиеся летучие мыши и сам Дьявол. Хотя целью было создать не страшное, а скорее чудесное кино, похожее на работы Мельеса, этот фильм стал первым примером того, как в кино можно использовать сверхъестественные элементы. Это был прецедент для будущих фильмов, и его заново сняли в 1977 году.
( Читать дальше )
- комментировать
- Комментарии ( 0 )
Nvidia сменит Intel в индексе Dow Jones — Ъ
- 02 ноября 2024, 10:48
- |
В индекс также добавят производителя красок Sherwin-Williams. Он заменит химическую компанию Dow, передает AFP.
Акции Nvidia в 2024 году выросли больше чем на 180%. Стоимость бумаг Intel за тот же период упала примерно на 50%.
www.kommersant.ru/doc/7281060
В гонке за президентское кресло в США: на данный момент решение можно принять подбросив монетку
- 27 июня 2024, 17:26
- |

Приближается новый год президентских выборов, и пора подготовиться к десяти месяцам взаимных обвинений, инсинуаций и разоблачений в потоке политических рекламных сообщений, от которых вы, возможно, захотите спрятаться к моменту голосования в ноябре. Тем временем, социологи будут пытаться предсказать победителя, а эксперты — объяснять, почему один из кандидатов плох для страны, а другой — нет.
Согласно социономической теории, социальное настроение не только регулирует фондовый рынок, но и влияет на шансы действующих политиков остаться у власти на новый срок. В предыдущих выпусках журнала «The Socionomist» упоминалось исследование Института социономики, посвящённое динамике фондового рынка и президентским выборам в США в 2012 году. Исследование охватывает период с переизбрания первого президента США Джорджа Вашингтона вплоть до конца октября перед днём выборов. Согласно исследованию, большинство действующих политиков (87,5 %) одерживали победу, когда фондовый рынок в течение трёх лет до последнего торгового дня перед выборами показывал рост в 20 % и более.
( Читать дальше )
Американская статистика утром
- 13 декабря 2022, 06:51
- |

Фьючерсы на акции без изменений, так как инвесторы ждут ключевого отчета по инфляции за ноябрь. Так как Америка ждет декабрьского заседания ФРС.
Фьючерсы на индекс Dow Jones Industrial Average подешевели на 0,04%, а фьючерсы на S&P 500 и Nasdaq 100 торговались без изменений.
Удачного торгового дня.
DOW JONES INDUSTRIALS AS OF THE CLOSE OF Thu. Sep. 1, 2022
- 04 сентября 2022, 11:30
- |
Мой друг, Cary Cimino, работает аналитиком на инвестиционные компании США
Он включил меня в список реципиентов его анализа.
Делюсь с вами.DOW JONES INDUSTRIALS AS OF THE CLOSE OF Thu. Sep. 1, 2022: The Dow Jones Industrials closing today at 3165642 is immediately trading down about 12% for the year from last year's settlement of 3633830. Immediately, this market has been rising for 2 years going into 2022 reflecting that this has been only still a bullish reactionary trend. yet it is trading below last year's close of 3633830.
Up to now, we still have only a 2 month reaction rally from the low established during June. We must exceed the 3 month mark in order to imply a trend is developing.
Our next daily target is Monday September 5th. The strongest target on the Weekly Array for a turning point will be 08/29/2022. This also falls within the next target on our Monthly Array will beSeptember which is also a Panic Cycle. Looking beyond the next key Monthly turning point in the Array we come to September which is a Panic Cycle suggesting that will perhaps become the next target thereafter.
The Dow Jones Industrials opened within last year's trading range which was 3667944 to 2985630. Right now, the market is still trading inside last year's trading range with the last print at 3165642. The last time such a similar pattern took place was 1960. Nonetheless, the market is trading below the opening print for the year which was at 3632159. As long as this market remains trading below 3330297 on a closing basis, then a similar year-end closing in this posture will warn that we could have a knee-jerk low in place this year.
Immediately, this market has been rising for 2 years going into 2022 reflecting that this has been only still a bullish reactionary trend. yet it is trading below last year's close of 3633830.
OUR CURRENCY CORRELATION MODELS
The Dow Jones Industrials did make a high in conjunction with the British pound on 06/01 yet in nominal terms the last high was created on 01/01 whereas the high in Australian dollar took place on 06/01, a high in the Canadian dollar was established on 06/01, a high in the Japanese yen was established on 06/01, a high in the Swiss franc was established on 06/01, a high in the Euro was established on 06/01, and a high in the Chinese yuan was 06/01.
In terms of a Basket of Currencies, we see that here this market has been neutral both in nominal and basket terms. In international terms, we have a divergence whereby this market last reached a high in nominal terms on 01/01 after the high in terms of a basket of currencies which came on 06/01 implying that this immediate rally is purely in domestic terms.
WEEKLY TIMING ARRAY PERSPECTIVE
The next target will be the week of August 29th with the opposite trend implied thereafter into the week of September 5th which is a Directional Change. We have overall 2 Weekly Directional Change targets ahead which align with a main turning points on the top line of the Array. Therefore, the targets of should be an important target. These targets in time are the week of September 5th and the week of October 31st. Directional Change targets that align with the top line for turning points often unfold as the main cyclical events. Don't forget, a Directional Change can also be a sharp dramatic move in the same direction, not just a change in direction.
END OF WEEK
Up to now, this market is making a retest of the previous low of 3014393 thereby it is still holding support. So far this week the trading range has been 3232516 to 3121975. The market has made a new low this week and the extent of this decline has been 12 trading days. The next Weekly Bullish Reversal to watch for the close of this week will be 3297204. The market is already trading above one Reversal at 2930270 implying perhaps at least a temporary low could be in place. Our next key Weekly Bullish Reversal stands at 3488920 from the low of the week of July 11th. The projected technical resistance this week stands at 3204695 and 3438623.
MONTHLY TIMING ARRAY PERSPECTIVE
September, which requires caution since this is also a Panic Cycle Target with the opposite trend implied thereafter into October which is a Directional Change. We have overall 2 Monthly Directional Change targets ahead which align with a main turning points on the top line of the Array. Therefore, the targets of April 2023 should be an important target. Directional Change targets that align with the top line for turning points often unfold as the main cyclical events. Don't forget, a Directional Change can also be a sharp dramatic move in the same direction, not just a change in direction.
We closed the previous month at 3284513Immediately, the market is somewhat bearish on our monthly indicating range models as was the case last month.
END OF QUARTER
The projected overhead technical resistance stands at 3461190. The projected technical support resides at 2796543. The next Quarterly Minor Bullish Reversal stands at 4036444 with the next Quarterly Major Bullish Reversal standing at 4862804. The next Quarterly Minor Bearish Reversal resides at 1967780 whereas the next Quarterly Major Bearish Reversal is to be found at 2985620. Immediately, the market is neutral on our indicating range models. However, the monthly level remains moderately bearish for nowWe also have a Minor Monthly Bearish which is closer to the market right now. This resides at 3001480 and therefore, even a month-end closing below this would signal a further retest of support is likely.
Since the last trading day of this month and quarter happens to also be the end of a week, then we additionally have Weekly Reversals coming into play as well. The next Weekly Minor Bullish Reversal is standing at 3309890while the Major Weekly Bullish stands at 3463120. However, the next Weekly Minor Bearish Reversal is to be found at 3063560 while the next Major Weekly Bearish Reversal is located at 3098280.
Therefore, when we put this all together, the various timing levels require our focus on the following Bearish Reversals for the close of this quarter. The numbers to watch are: 3098280, 3001480, and 2985620.
HYPOTHETICAL MODEL ANALYSIS
Turning to our Tentative Hypothetical Models, we see that we have Daily Bullish Reversals that would be generated if we see another new low penetrating 3121975. These Tentative Hypothetical Bullish Reversals would stand at 3220567, 3260955, 3336480, and 3428136, whereas a close above the previous high 3167751 would tend to suggest that these Tentative Hypothetical Bullish Reversals will then become fixed as long as the low holds thereafter for at least several days. Moreover, the election of any of these Tentative Bullish Reversals during that session would signal a bounce is unfolding and that such a low may stand. However, if we continue to make new lows, then these WHAT-IF Reversals will be replaced by a new set until the low becomes fixed.
Applying our Tentative Hypothetical Models, we see that we have Weekly Bullish Reversals that would be generated if we see another new low penetrating 3227822. These Tentative Hypothetical Bullish Reversals would stand at 3291019, 3327234, 3376710, and 3417908, whereas a close above the previous high 3358659 would tend to suggest that these Tentative Hypothetical Bullish Reversals will then become fixed as long as the low holds thereafter for at least several days. Moreover, the election of any of these Tentative Bullish Reversals during that session would signal a bounce is unfolding and that such a low may stand. However, if we continue to make new lows, then these WHAT-IF Reversals will be replaced by a new set until the low becomes fixed.
REVERSAL SYSTEM
Utilizing our Reversal System, our next Daily Bullish Reversal to watch stands at 3233630 while the Daily Bearish Reversal lies at 3111430. This provides a very near-term 6.03% trading range. Using the Weekly level, the next Bullish Reversal to watch stands at 3297204 while the Weekly Bearish Reversal lies at 3098280. This provides a 6.03% trading range. Now moving to the broader Monthly level, the current Bullish Reversal stands at 3509160 while the Bearish Reversal lies at 3001480. This, naturally, gives us the main broad trading range of 14%.
WIDE-RANGING CLOSING TREND CHANGE POINTS
Change in Trend Indicator
Daily… 3237409
Weekly… 3153649
Monthly… 3191935
Quarterly… 3047917
Yearly… 1768855
Note: This indicator identifies the tone of the market on each time level. A positive number indicates the market is still in a bullish posture on that time level. Negative numbers indicate that the market is in a bearish posture on that time level. The indication is provided only on a closing basis. The broader change in trend takes place only on the monthly to yearly levels. Those looking for exit strategies may look at these numbers on a closing basis per level. When a major turning point is approached according to our yearly models, ECM, and timing arrays, then you can move from the higher levels to the lower to exit a market closer to the turning point.
Up to now, we have broken below last week's low and that means we have generated a new What-If Weekly Bullish Reversal which lies above the present trading level at the general area of 3376708 warning that this decline has still not punched through important overhead resistance. A weekly closing beneath this level will keep this market in a bearish tone. Up to now, we have broken below last month's low and that means we have generated a new What-If Monthly Bullish Reversal which lies above the present trading level at the general area of 3327234 warning that this decline has still not punched through important overhead resistance. A monthly closing beneath this level will keep this market in a bearish tone.
RISK FACTORS
Dow Jones Industrials Risk Table
— UPSIDE RISK — DOWNSIDE RISK ---
DAILY… 3233630 | 2.147% | 3111430 | 1.712% |
WEEKLY… 3297204 | 4.155% | 3098280 | 2.127% |
MONTHLY… 3509160 | 10.85% | 3001480 | 5.185% |
QUARTERLY… 3326000 | 5.065% | 2985620 | 5.686% |
YEARLY… 4272141 | 34.95% | 2171240 | 31.41% |
NORMAL DAILY TRADING ENVELOPE
Last Close Was. 3165642
Envelope Top… 3446504
Internal AvgL… 3172551
Internal AvgH… 3256295
Envelope Btm… 3129072
PIVOT POINTS
Looking at our Pivot Points, the market is trading above one indicating pivot implying that this market is in a positive position with support at 3158822 and resistance at 3183361 and 3177593 for this next trading session.
DAILY PIVOT POINTS
3183361
3177593
3158822
Projected technical Support tomorrow lies at 3137233 and 3152186. Naturally, opening below this area will cause it to become resistance. Projected technical Resistance stands tomorrow at 3172370 3183009. Keep in mind that these targets can provide intraday resistance or closing resistance. Opening above this area will cause it to become support.
RECREATING TIME
Based upon our What-If Yearly Models where time is relative, assuming today Thu. 1st would be constructively the end of the year, we are currently trading above all What-If Yearly Bullish Reversals for today's theoretical year-end closing. This is on all four dimensions implying we are still in a broader bullish trend for now. Keep in mind, that these are what-if reversals good EXCLUSIVELY for today only.
[Note: Time is relative so this model creates time so we have a Yearly Bullish/Bearish Reversal Each Day. This allows us to see if the broader trend is shifting instead of having to wait for year-end.]
----------------------------------------------------------------
The Energy Model is measuring the bulls against the bears. It is providing a different measurement of how much 'energy' remains in the market from the long-side. Therefore, if people are recently long, it shows to what extent that represents the whole of the market position. A crash is possible when energy is at a high level and a rally is likely when energy is negative. This is based upon our proprietary models and not the published numbers of longs and shorts.
DAILY FIBONACCI RETRACEMENTS & PERCENTAGE MOVEMENTS
Here are the Fibonacci Percentage Retracements from the previous HIGH at 3428136
23% | 2619096
38% | 2118588
61% | 1309548
78% | 733621
Fibonacci Percentage Golden Ratio Movements:
3% | 2022/08/19
5% | 2022/08/23
8% | 2022/08/26
13% | 2022/09/02
21% | 2022/09/14
34% | 2022/10/03
55% | 2022/11/01
89% | 2022/12/19
Вульф по Dow Jones
- 16 августа 2022, 14:07
- |
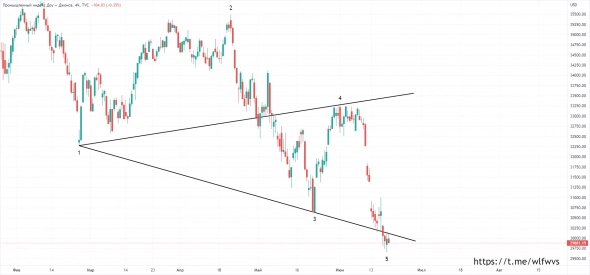
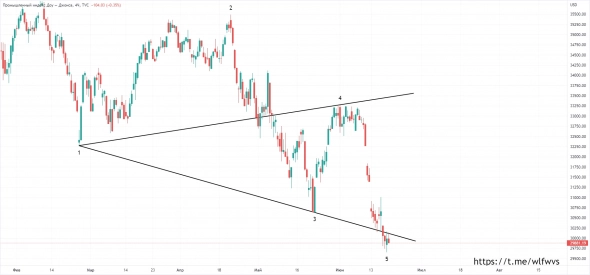
Пост из телеграм-канала от 21 июня 2022:
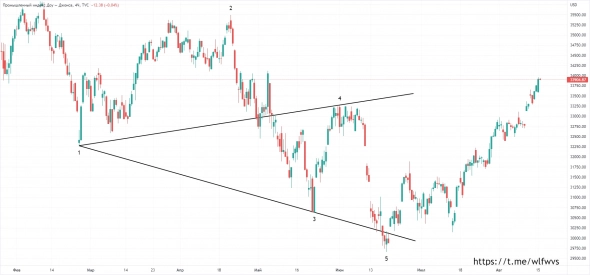
Волна Вульфа в индексе Dow Jones Industrial Average

16 августа 2022:

( Читать дальше )
Вульф по Dow Jones
- 28 июня 2022, 14:55
- |

Не является инвестиционной рекомендацией
Больше паттернов Волн Вульфа в телеграм-канале @wlfwvs
Не очень приятный сюрприз CPI
- 11 мая 2022, 19:07
- |
Вчера фондовый рынок отработал не так хорошо, как ожидалось, но и не так плохо, как опасались. Были покупки, затем были продажи, а затем снова были покупки, прежде чем продать перед закрытием. Конечным результатом стал рост Nasdaq Composite на 1,0%, рост S&P 500 на 0,3% и убыток на 0,3% индекса Dow Jones Industrial Average.
Ключевым моментом, который можно почерпнуть из вчерашней торговли, является относительная сила акций мега-капитализации. Если более широкий рынок собирается предпринять значимые усилия по восстановлению, эти акции должны занять лидирующие позиции.
Одна из самых больших проблем фондового рынка в этом году заключается в том, что именно эти акции сильно отстают. Еще одной серьезной проблемой для фондового рынка стал быстрый рост рыночных ставок, который последовал за быстрыми изменениями в риторике ФРС по денежно-кредитной политике и ускорением темпов инфляции.
( Читать дальше )
Ожидается снижение, но могло быть и хуже
- 29 апреля 2022, 19:46
- |
В настоящее время фьючерсы на S&P 500 упали на 41 пункт и торгуются на 0,8% ниже справедливой стоимости, фьючерсы на Nasdaq 100 упали на 165 пунктов и торгуются на 1,2% ниже справедливой стоимости, а фьючерсы на Dow Jones Industrial Average упали на 133 пункта и торгуются на 0,1% ниже справедливой стоимости.
Учитывая все обстоятельства, это совсем не плохо. На самом деле, можно даже сказать, что это обнадеживает.
Если бы мы сказали вам, что Amazon.com (AMZN) упал на 10,1% после отчета о доходах, а Apple (AAPL) упал на 1,2% после отчета о доходах, вы бы подумали, что фьючерсы на S&P 500 были бы всего на 0,8% ниже справедливого уровня? ценность? Это не то, чего мы ожидали, но это реальность.
Все могло быть хуже. В конце концов, и Exxon (XOM), и Chevron (CVX) потеряли 0,5-0,8% после своих отчетов о доходах, цены на нефть выросли, индекс потребительских цен еврозоны поднялся до нового рекордного максимума в апреле (+7,5). % в год), а рынок фьючерсов на федеральные фонды, согласно инструменту CME FedWatch, оценивает с вероятностью 94,5% повышение ставки на 75 базисных пунктов на июньском заседании FOMC в дополнение к ожидаемому повышению ставке на 50 базисных пунктов на заседании FOMC на следующей неделе.
( Читать дальше )
Короткая неделя, чтобы открыться на слабой ноте
- 11 апреля 2022, 18:51
- |
Это будет укороченная неделя торговли. Рынки закрыты в пятницу в связи со Страстной пятницей. Тем не менее, на неделе будет много важной информации. Сегодня затишье как в экономической сфере, так и в сфере доходов, но шум будет усиливаться.
Отчет об индексе потребительских цен (CPI) выходит во вторник, за ним последует отчет об индексе цен производителей (PPI) в среду и отчет о розничных продажах в четверг. Отдельно Китай сообщил о более высоких, чем ожидалось, данных CPI и PPI за март за выходные.
Между ними будут отчеты о доходах от Albertsons (ACI), CarMax (KMX), Delta Air Lines (DAL), Fastenal (FAST), UnitedHealth (UNH) и множества банков, включая JPMorgan Chase (JPM), Citigroup ( C), Goldman Sachs (GS), Morgan Stanley (MS), PNC (PNC), U.S. Bancorp (USB) и Wells Fargo (WFC).
Неизвестно, что произойдет на российско-украинском фронте, хотя The Wall Street Journal сообщает, что Россия планирует вскоре крупное наступление на востоке Украины. Кроме того, COVID захватывает Китай, и ответные меры политики Китая сдерживают нормальную деятельность в ряде городов, в первую очередь в Шанхае, что подрывает перспективы роста.
( Читать дальше )
- bitcoin
- brent
- eurusd
- forex
- gbpusd
- gold
- imoex
- ipo
- nasdaq
- nyse
- rts
- s&p500
- si
- usdrub
- wti
- акции
- алготрейдинг
- алроса
- аналитика
- аэрофлот
- банки
- биржа
- биткоин
- брокеры
- валюта
- вдо
- волновой анализ
- волны эллиотта
- вопрос
- втб
- газ
- газпром
- гмк норникель
- дивиденды
- доллар
- доллар рубль
- евро
- золото
- инвестиции
- индекс мб
- инфляция
- китай
- кризис
- криптовалюта
- лидеры роста и падения ммвб
- лукойл
- магнит
- ммвб
- мобильный пост
- мосбиржа
- московская биржа
- мтс
- нефть
- новатэк
- новости
- обзор рынка
- облигации
- опрос
- опционы
- отчеты мсфо
- офз
- оффтоп
- прогноз
- прогноз по акциям
- раскрытие информации
- ри
- роснефть
- россия
- ртс
- рубль
- рынки
- рынок
- санкции
- сбер
- сбербанк
- северсталь
- си
- сигналы
- смартлаб
- сущфакты
- сша
- технический анализ
- торговля
- торговые роботы
- торговые сигналы
- трейдер
- трейдинг
- украина
- фондовый рынок
- форекс
- фрс
- фьючерс
- фьючерс mix
- фьючерс ртс
- фьючерсы
- цб
- цб рф
- экономика
- юмор
- яндекс


 Новости тг-канал


