Избранное трейдера DvF
Автоматизация торговли для нищеброда. Парсер+исходники для автоматизации торговли через Tradingview.
- 11 ноября 2018, 12:35
- |
Добрый день, друзья!
Писать много не буду. Напомню лишь о том, что если у Вас есть стойкое желание автоматизировать свою торговлю при этом сделать это с минимальными издержками без покупки дорогостоящего ПО, то решением может стать использование возможностей сайта Tradingview и моего парсера (см. детальную информацию о нем в постах:1, 2 и 3).
Возможности сайта Tradingview:
- Написание торговых стратегий любой сложности с использование большого количества встроенных индикаторов и уже готовых скриптов. По мне встроенный язык PinrScript (скриптовый язык понятный даже не программисту) на много удобнее, чем построение робота из визуальных блоков (а главное точнее быстрее).
- Тестирование стратегий с использование внутреннего тестера (модуль оптимизации, к сожалению, отсутствует).
- Большое трейдерское сообщество, можно подчерпнуть интересные идеи.
- График котировок в режиме реального времени, а главное всё вышеописанное бесплатно.
( Читать дальше )
- комментировать
- 4.6К | ★44
- Комментарии ( 7 )
график Газпром в долларах для Квика
- 25 октября 2018, 19:48
- |
2. В этой папке создаем файл gazp_usd.lua, туда записываем:
Settings =
{
   Name = "GAZPROM_USD",
   tag = "GAZP",
   tag1 = "GAZP_USDRUB",
   line=
   {
      {Name = "line1", Color = RGB(0, 0, 255), Type = 1,Width = 1}
   }
}

vPrice=1;

function Init()
   return 1
end

function OnCalculate(index)
	local vOutFlag=0;
	local vGazp =(getCandlesByIndex(Settings.tag, 0, index-1, 1)[0].close or 1) ;
	local vUSDRUB=(getCandlesByIndex(Settings.tag1, 0, index-1, 1)[0].close or 1);
	if vGazp>0 then
		vOutFlag=1;
	else
		vOutFlag=0;
	end;
	if vUSDRUB>0 then
		vOutFlag=1;
	else
		vOutFlag=0;
	end;
	if vOutFlag > 0 then
		local Out = vGazp/vUSDRUB;
		vPrice=Out;
	end;
	return  vPrice
end
3. В Квике создаем график с курсом доллара (USDRUB_TOM).4. К графику добавляем график Газпрома (ГАЗПРОМ ао).
5. Идем в настройки графика, в разделе «Дополнительно» указываем «Идентификатор»: GAZP -для графика с ценой Газпрома, GAZP_USDRUB -для графика с курсом.
6. Добавляем индикатор (выбираем из выпадающего списка GAZPROM_USD).

7. Уменьшаем ненужные поля. Если график не отобразился — даблкликаем на графике — жмем «Применить»:
( Читать дальше )
QUIK: Бенчмарк ОФЗ к ставке ЦБ
- 21 октября 2018, 20:21
- |
Основные параметры доходность и премия к ставке ЦБ, с учетом дюрации.
Скрипт не работает онлайн (оперативность тут не принципиальна), при запуске собирает параметры в таблицу и выводит на экран.
В дальнейшем планируется эти данные использовать для анализа премии доходности по дюрации для муниципальных и корпоративных облигаций к ОФЗ.
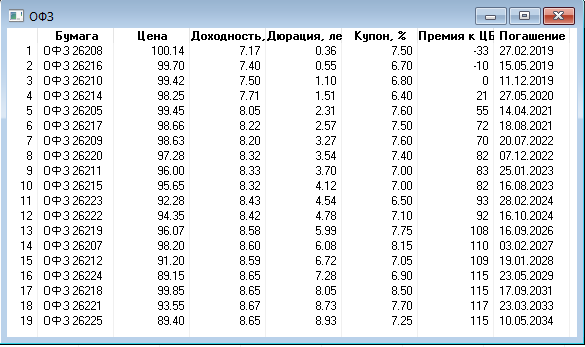
Код скрипта на github (на github две версии одна в utf-8 для просмотра и основная версия в win1251, т.к. quik понимает только его):
github.com/trantor77/lua_scripts/boundsOFZ.lua
Код скрипта:
--переменные
keyRateCB = 7.5
classCode = "TQOB"

function CreateTable()
    t_id = AllocTable()
    AddColumn(t_id, 0, "Бумага", true, QTABLE_STRING_TYPE, 15)
    AddColumn(t_id, 1, "Цена", true, QTABLE_DOUBLE_TYPE, 15)
    AddColumn(t_id, 2, "Доходность, %", true, QTABLE_DOUBLE_TYPE, 15)
    AddColumn(t_id, 3, "Дюрация, лет", true, QTABLE_DOUBLE_TYPE, 15)
    AddColumn(t_id, 4, "Купон, %", true, QTABLE_DOUBLE_TYPE, 15)
    AddColumn(t_id, 5, "Премия к ЦБ, бп", true, QTABLE_INT_TYPE, 15)
    AddColumn(t_id, 6, "Погашение", true, QTABLE_STRING_TYPE, 15)
    t = CreateWindow(t_id)
    SetWindowCaption(t_id, "ОФЗ")
end

function string.split(str, sep)
    local fields = {}
    str:gsub(string.format("([^%s]+)", sep), function(f_c) fields[#fields + 1] = f_c end)
    return fields
end

function getParamNumber(code, param)
    return tonumber(getParamEx(classCode, code, param).param_value)
end

function formatData(prm)
    return string.format("%02d.%02d.%04d", prm%100, (prm%10000)/100, prm/10000)
end

CreateTable()

arr = {}
sec_list = getClassSecurities(classCode)
sec_listTable = string.split(sec_list, ',')
j = 0
for i = 1, #sec_listTable do
    secCode = sec_listTable[i]
    securityInfo = getSecurityInfo(classCode, secCode)
    short_name = securityInfo.short_name
    if short_name:find("ОФЗ 26") ~= nil then
        j = j + 1
        r = {}
        r["short_name"] = short_name
        r["price"] = getParamNumber(securityInfo.code, "PREVPRICE")
        r["yield"] = getParamNumber(securityInfo.code, "YIELD")
        r["duration"] = getParamNumber(securityInfo.code, "DURATION")/365
        couponvalue = getParamNumber(securityInfo.code, "COUPONVALUE")
        couponperiod = getParamNumber(securityInfo.code, "COUPONPERIOD")
        r["coupon"] = ((365/couponperiod) * couponvalue)/10
        r["bonus"] = (r["yield"] - keyRateCB)*100
        r["mat_date"] = getParamNumber(securityInfo.code, "MAT_DATE")
        table.insert(arr, j, r)
    end
end

table.sort(arr, function(a,b) return a["duration"] < b["duration"] end)

for j = 1, #arr do
    row = InsertRow(t_id, -1)
    SetCell(t_id, row, 0, arr[j]["short_name"])
    price = arr[j]["price"]
    SetCell(t_id, row, 1, string.format("%.2f", price), price)
    yield = arr[j]["yield"]
    SetCell(t_id, row, 2, string.format("%.2f", yield), yield)
    duration = arr[j]["duration"]
    SetCell(t_id, row, 3, string.format("%.2f", duration), duration)
    coupon = arr[j]["coupon"]
    SetCell(t_id, row, 4, string.format("%.2f", coupon), coupon)
    bonus = arr[j]["bonus"]
    SetCell(t_id, row, 5, string.format("%.0f", bonus), bonus)
    mat_date = arr[j]["mat_date"]
    SetCell(t_id, row, 6, formatData(mat_date), mat_date)
endИндикатор ThinkOrSwim рисует на графике линии вчерашних Hi, Low, Close, Open и сегодняшнего Open
- 15 октября 2018, 19:44
- |
Рисует линии вчерашних Hi, Low, Close, Open и сегодняшнего Open на графике
Очень удобно, наглядно показывает важные уровни вчерашнего дня.
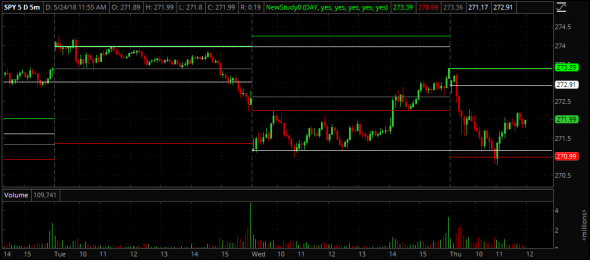
#Thinkorswim studies
#Рисует линии вчерашних Hi, Low, Close, Open и сегодняшнего Open на графике.
#Thinkorswim  https://radchenkovy.com/thinkorswim-live

input sPeroid = {default DAY, WEEK, MONTH};
input iHigh = {default "yes", "no"};
input iLow = {default "yes", "no"};
input iClose = {default "yes", "no"};
input iOpen = {default "yes", "no"};
input iTodayOpen = {default "yes", "no"};
plot pHigh = if !iHigh then high(period = sPeroid)[1] else Double.NaN;
plot pLow = if !iLow then low(period = sPeroid)[1] else Double.NaN;
plot pClose = if !iClose then close(period = sPeroid)[1] else Double.NaN;
plot pOpen = if !iOpen then open(period = sPeroid)[1] else Double.NaN;
plot pTodayOpen = if !iTodayOpen then open(period = sPeroid)[0] else Double.NaN;

pHigh.SetDefaultColor (Color.GREEN);
pHigh.SetPaintingStrategy(PaintingStrategy.DASHES);
pLow.SetDefaultColor(Color.RED);
pLow.SetPaintingStrategy(PaintingStrategy.DASHES);
pClose.SetDefaultColor (Color.GRAY);
pClose.SetPaintingStrategy(PaintingStrategy.DASHES);
pOpen.SetDefaultColor (Color.WHITE);
pOpen.SetPaintingStrategy(PaintingStrategy.DASHES);
pTodayOpen.SetDefaultColor (Color.WHITE);
pTodayOpen.SetPaintingStrategy(PaintingStrategy.DASHES);;
Полная библиотека индикаторов, фильтров и сканеров для Thinkorswim в этом блоге bit.ly/2vKq4F8
Парсер котировок Финама
- 30 августа 2018, 01:12
- |
---
Написал простенькую функцию, которая работает с архивом графиков Финама. На Финаме есть история торгов за много лет. Это полезно, чтобы прогнать вашу стратегию на максимально доступных исторических данных.
Архив Финама находится здесь: https://www.finam.ru/profile/moex-akcii/sberbank/export/
---
Заходите по ссылке, видите там:
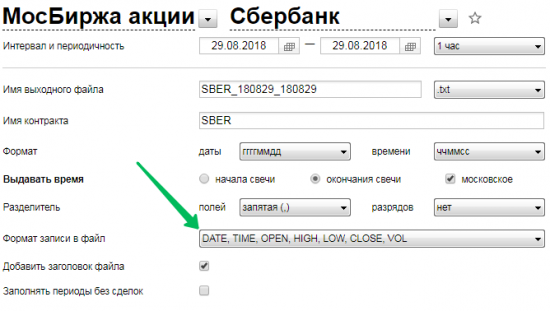
Там где «Формат записи в файл» выбираете как у меня: DATE,TIME,OPEN,HIGH,LOW,CLOSE,VOL. Можно брать и другие форматы, но тогда код функции придётся переписать.
---
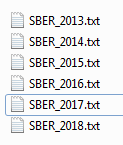
Выбираете вверху даты с 1 января по 31 декабря и год за годом сохраняте себе на компьютер вот так:
( Читать дальше )
Как Python помогает заменить финконсультантов
- 15 августа 2018, 21:52
- |
В продолжение статьи о вреде избыточной диверсификации создадим полезный инструментарий️ по подбору акций. После этого сделаем простую ребалансировку⚖️ и добавим уникальные условия технических индикаторов, которых так часто не хватает в популярных сервисах. А затем сравним доходность отдельных активов и различных портфелей.
Во всем этом задействуем Pandas и минимизируем количество циклов. Погруппируем времянные ряды и порисуем графиков. Познакомимся с мультииндексами и их поведением. И всё это в Jupyter на Python 3.6.
( Читать дальше )
SWT-метод. 1. Классический технический анализ
- 07 августа 2018, 17:39
- |
1. Классический технический анализ
2. SWT-метод. Теория
3. SWT-метод. Практика применения
4. Пример анализа трендов
5. Торговые тактики
6. Дополнительные условия (фильтры сделок)
7. Риск-менеджмент
Часть 1. Классический технический анализ и проблемы его применения
СОДЕРЖАНИЕ
1.1. Аналитическая поддержка торговых операций
1.2. Что такое тренд в техническом анализе? Виды трендов
1.3. Глубина коррекции как критерий смены типа тренда
( Читать дальше )
Как быстро из PostgreSQL и ClickHouse получить в Python длинные истории цен
- 15 июля 2018, 20:43
- |
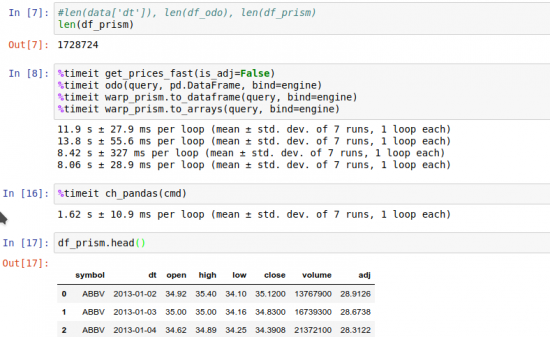
Разбил много ☕кружек в поисках решения для ️быстрого получения длинных историй цен для большого количества активов в Python. Ещё имел смелость желать работать с ценами в numpy-массивах, а лучше сразу в pandas.
Стандартные подходы в лоб работали разочаровывающе, что приводило к выполнению запроса к БД в течение 30 секунд и более. Не желая мириться, я нашёл несколько решений, которые полностью меня удовлетворили.
( Читать дальше )
Новый проект
- 02 июля 2018, 15:55
- |
Новый проект
Решил сделать новый проект. Его суть в следующем:
У каждого трейдера есть какая-то стратегия торговли, и наверняка не очень удобно постоянно сидеть возле монитора, другое дело, если тебе на телефон приходит сигнал, по твоей стратегии и далее ты уже принимаешь решение: стоит входить или нет, либо можно будет подписаться на стратегию другого трейдера, если он даст приглашение, конечно. Новый проект как раз будет реализовывать это. Буду рад, если вы проголосуете)
- bitcoin
- brent
- eurusd
- forex
- gbpusd
- gold
- imoex
- ipo
- nasdaq
- nyse
- rts
- s&p500
- si
- usdrub
- wti
- акции
- алготрейдинг
- алроса
- аналитика
- аэрофлот
- банки
- биржа
- биткоин
- брокеры
- валюта
- вдо
- волновая разметка
- волновой анализ
- волны эллиотта
- вопрос
- втб
- газ
- газпром
- гмк норникель
- дивиденды
- доллар
- доллар рубль
- евро
- золото
- инвестиции
- индекс мб
- инфляция
- китай
- кризис
- криптовалюта
- лукойл
- магнит
- ммвб
- мобильный пост
- мосбиржа
- московская биржа
- мтс
- натуральный газ
- нефть
- новатэк
- новости
- обзор рынка
- облигации
- опрос
- опционы
- отчеты мсфо
- офз
- оффтоп
- прогноз
- прогноз по акциям
- путин
- раскрытие информации
- ри
- роснефть
- россия
- ртс
- рубль
- рынки
- рынок
- санкции
- сбер
- сбербанк
- северсталь
- смартлаб
- сущфакты
- сша
- технический анализ
- торговля
- торговые роботы
- торговые сигналы
- трамп
- трейдинг
- украина
- фондовый рынок
- форекс
- фрс
- фьючерс
- фьючерс mix
- фьючерс ртс
- фьючерсы
- цб
- цб рф
- экономика
- юмор
- яндекс


 Новости тг-канал