

SMART-LAB
Новый дизайн
Мы делаем деньги на бирже


Информация


Блог им. NektoFinkelmaer
График влево
- 19 марта 2024, 12:28
- |

Гуру рынка говорят — график цены акции может идти иногда вверх, иногда вниз и всегда вправо.
Как же они ошибались!
Держи график влево, да еще и не один, добавь сколько хочешь инструментов с фондовой секции ММВБ.
Скрипт стягивает данные с iss.moex.com/ рисует график и зиг-заг. (интервал час)
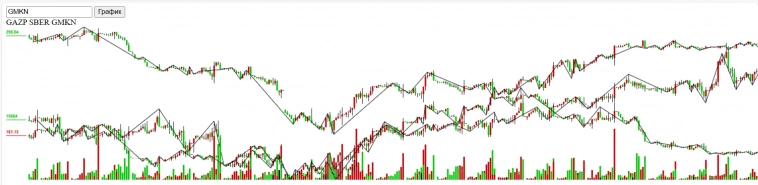
Пользуйся — и твой трейдинг выйдет на новый уровень.
Как же они ошибались!
Держи график влево, да еще и не один, добавь сколько хочешь инструментов с фондовой секции ММВБ.
Скрипт стягивает данные с iss.moex.com/ рисует график и зиг-заг. (интервал час)
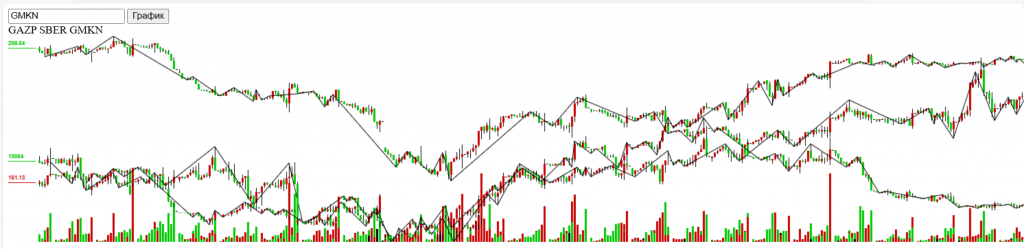
Пользуйся — и твой трейдинг выйдет на новый уровень.
<!DOCTYPE html>
<html>
<head>
    <meta charset="utf-8" />
</head>
<body>

<form name="search">
    <input type="text" name="key" placeholder="Тикер" id="key"/>
    <input type="button" name="buttonChart" value="График" />
</form>
<div id="printBlock"></div>
<canvas id="chart" width="4000" height="300"></canvas>
<script>
const keyBox = document.search.key;
const keyButton = document.search.buttonChart;

 function DrawChart(prices,minPrice,maxPrice,maxVolume,ZZ){

	var chart = document.getElementById("chart");


	if (chart.getContext) {
		var ctx = chart. <a name="cut"></a> getContext("2d");
		Point = 0;
		for (let i = prices.length-1; i >= 0; i--) {
			var K=300/(maxPrice-minPrice);
			pOpen = Math.trunc((prices[i].Open-minPrice)*K);
			pClose = Math.trunc((prices[i].Close-minPrice)*K);

			pMin = Math.trunc((prices[i].Low-minPrice)*K);
			pMax = Math.trunc((prices[i].High-minPrice)*K);

			dStart = 300-Math.max(pOpen,pClose);
			dFinish = 300-Math.min(pOpen,pClose);

			dMin = 300-pMin;
			dMax = 300-pMax;

			pVolume = Math.trunc((prices[i].Volume)/maxVolume*100);
			dVolume = 300-pVolume;

			var AA = prices[i].Close - prices[i].Open;

			//ctx.beginPath();
			if (prices[i].Open==prices[i].Close) {

				ctx.fillStyle = "rgb(0,0,0)";
				dFinish = dFinish+1;
			}
			else {

				if (prices[i].Open>prices[i].Close) {
					ctx.fillStyle = "rgb(200,0,0)";
				}
				else{
					ctx.fillStyle = "rgb(0,200,0)";
				}

			}
			//console.log(""+dStart+" "+dFinish + " "+AA+" "+pOpen+" "+pClose+" "+K);

			if (Point==0) {
				ctx.fillRect(Point, dStart, 40, 1);

				ctx.textBaseline = "bottom";
				ctx.font = "bold 8px Arial";

				ctx.fillText(prices[i].Close, Point, dStart-2);

				Point = Point+11;
			}


			ctx.fillRect(Point*4, dStart, 3, dFinish-dStart);

			ctx.fillStyle = ctx.fillStyle.replace(")",",0.7)");

			//console.log(""+prices[i].Volume+" "+maxVolume + " "+pVolume+" "+dVolume+" "+ctx.fillStyle);

			ctx.fillRect(Point*4, dVolume, 3, 300-dVolume);

			ctx.fillStyle = "rgb(0,0,0)";
			ctx.fillRect(Point*4+1, dMax, 1, dStart-dMax);
			ctx.fillRect(Point*4+1, dFinish, 1, dMin-dFinish);
			Point ++;
		}

		ctx.fillStyle = "rgb(0,0,0,0.7)";
		ctx.beginPath();

		for (let i = 0; i < ZZ.length; i++) {

			Point = (prices.length - ZZ[i].Point+10)*4+1;
			var K=300/(maxPrice-minPrice);
			pPrice = Math.trunc((ZZ[i].price-minPrice)*K);
			dStart = 300-pPrice;

			//console.log(""+ZZ[i].price+" "+dStart+ " "+ZZ[i].Point+" "+ZZ[i].T);

			if (i==0) {
				ctx.moveTo(Point,dStart);
			} else {
				ctx.lineTo(Point,dStart);
			}
		}
		ctx.stroke();
	}
 }
 function FillArray (data){

	var prices = [];
	var pricesDay = [];
	var ZZ = [];
	var minPrice = 9999999;
	var maxPrice = 0;
	var maxVolume = 0;

	let md = data['candles']['data'];

	for (let i = 0; i < md.length; i++) {
		var cl = prices.length;
		prices[cl] = [];
		prices[cl] = {Period:md[i][6], Open:md[i][0], Close:md[i][1],Low:md[i][3], High:md[i][2], Volume:md[i][5], Period:md[i][6]}
		if (minPrice>prices[cl].Low) {
				minPrice = prices[cl].Low;
		}
		if (maxPrice<prices[cl].High) {
				maxPrice = prices[cl].High;
		}
		if (maxVolume<prices[cl].Volume) {
				maxVolume = prices[cl].Volume;
		}

		var cDay = prices[cl].Period;
		cDay = cDay.substring(1,10);


		PosDay=pricesDay.findIndex(item => item.Period == cDay);
		if (PosDay==-1) {PosDay=pricesDay.length; pricesDay[PosDay]={Period:cDay,High:prices[cl].High,Low:prices[cl].Low,PeriodHi:i,PeriodLow:i}}
		if (pricesDay[PosDay].High<prices[cl].High) {pricesDay[PosDay].High=prices[cl].High;pricesDay[PosDay].PeriodHi=i;}
		if (pricesDay[PosDay].Low>prices[cl].Low) {pricesDay[PosDay].Low=prices[cl].Low;pricesDay[PosDay].Low=i;}

		if (cl>1) {
			if (ZZ.length == 0) {
				ZZ[0] = {price:(prices[cl-2].Open>prices[cl].Close ? prices[cl-2].High:prices[cl-2].Low), Point:cl-2, T:(prices[cl-2].Open>prices[cl].Close ? -1:1)}

				//console.log("f "+ZZ[ZZ.length-1].price+" "+" "+ZZ[ZZ.length-1].Point+" "+ZZ[ZZ.length-1].T);

			} else {
				if (ZZ[ZZ.length-1].T == 1) {
					//console.log("up "+ZZ[ZZ.length-1].price+" "+" "+ZZ[ZZ.length-1].Point+" "+ZZ[ZZ.length-1].T);

					if (prices[cl-2].High<prices[cl].High || prices[cl-1].High<prices[cl].High || prices[cl-2].Low<prices[cl].Low || prices[cl-1].Low<prices[cl].Low) {}
					else {
							ZZ[ZZ.length]={price:(Math.max(prices[cl-2].High,prices[cl-1].High)),Point:(prices[cl-2].High>prices[cl-1].High ? cl-2:cl-1),T:-1}

							//console.log("up "+ZZ[ZZ.length-1].price+" "+" "+ZZ[ZZ.length-1].Point+" "+ZZ[ZZ.length-1].T);
						}
					}
				else {
					if (ZZ[ZZ.length-1].T == -1) {
						if (prices[cl-2].Low>prices[cl].Low || prices[cl-1].Low>prices[cl].Low || prices[cl-2].High>prices[cl].High || prices[cl-1].High>prices[cl].High) {}
						else {
							ZZ[ZZ.length]={price:(Math.min(prices[cl-2].Low,prices[cl-1].Low)),Point:(prices[cl-2].Low<prices[cl-1].Low ? cl-2:cl-1),T:1}
							//console.log("dw "+ZZ[ZZ.length-1].price+" "+" "+ZZ[ZZ.length-1].Point+" "+ZZ[ZZ.length-1].T);
						}

					}
				}

			}
		}
	}
	DrawChart(prices,minPrice,maxPrice,maxVolume,ZZ);
	return prices;
 }

 function strRight(n,str){
   return str.substring(str.length-n,str.length);
 }
// обработчик изменения текста
function onchange(e){
    // получаем элемент printBlock
    const printBlock = document.getElementById("printBlock");
	const tiker = document.getElementById("key").value;
    // получаем новое значение
    const val = tiker;
    // установка значения
    printBlock.textContent = printBlock.textContent+" "+tiker;


	var URL = "https://iss.moex.com/iss/engines/stock/markets/shares/securities/<TIKER>/candles.json?from=<DateFrom>&interval=60";

	URL = URL.replace("<TIKER>", val);

	var now = new Date();
	var Month=now.getMonth()-1;
	var year=now.getFullYear();
	if (Month<0) {Month=12+Month+1; year--;};
	var startdata = (year).toString()+"-"+strRight(2,"0"+Month.toString())+"-"+strRight(2,"0"+now.getDate().toString());

	URL = URL.replace("<DateFrom>", startdata);

	fetch(URL)
		.then(function (response) {
			return response.json();
		})
		.then(function (data) {

			FillArray(data);

		})

}


//keyBox.addEventListener("change", onchange);
keyButton.addEventListener("click", onchange);
</script>
</body>
</html>352
Читайте на SMART-LAB:

BRENT: цены снова сползают после взлета с призрачными надеждами на перемирие
Нефть продолжила расти и подскочила до очередных локальных максимумов, после чего последовал планомерный откат. Такая динамика сформировалась под...

15:53
⚡️ Завтра – День инвестора Займера
Напоминаем, что День инвестора Займера состоится уже завтра в 18:00 МСК. Подключайтесь к трансляции удобным для вас способом: 🔗 VK Video 🔗...

11:00


теги блога Nekto Finkelmaer
- акции
- алготрейдинг
- альфа-банк
- банки
- втб
- итоги месяца
- Китай
- криптовалюта
- мобильный пост
- налоговая реформа
- налогообложение на рынке ценных бумаг
- НДФЛ
- Пенсия
- повышение НДФЛ
- Портфель инвестора
- прогрессивная шкала налогообложения
- северный морской путь
- тейдинг
- торговые роботы
- торговый софт
- трейдинг
Вот это тут лишнее, вставляет smart-lab.