sanek-ntx
Brent,шорт среднесрочно
- 13 октября 2018, 11:57
- |
1) как мы уже знаем что Brent коррелирует с S&P в 75 % случиях

2)Иранские санкции способствуют неопределенности поставок
В октябре 2018 года Управление энергетической информации США увеличило прогнозную спотовую цену на нефть марки Brent до $74 за баррель (b) в 2018 году и до $75/b в 2019 году, увеличившись на $2/b и $1/b, соответственно, по сравнению с прогнозом прошлого месяца. ожидает, что цены на сырую нефть West Texas Intermediate (WTI) будут в среднем около $68/б в 2018 году и $70/Б в 2019 году. Октябрьский прогноз STEO отражает реакцию рынка на значительную неопределенность в отношении последствий санкций для Ирана, а также ответные действия членов Организации стран-экспортеров нефти (ОПЕК) и других стран.
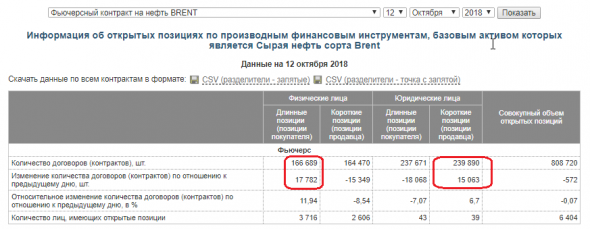
3) Информация об открытых позициях на 12 октября!
Физические лица наберают длинные позиции, юредические лица сокрощают по длинным и набирают шорт!

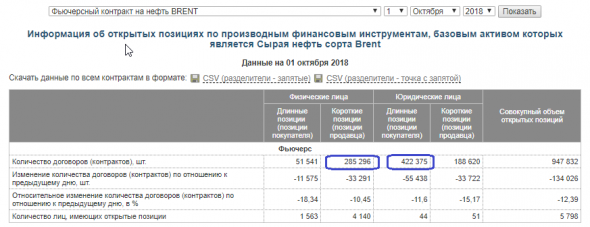
4) Информация об открытых позициях на 1октября

- комментировать
- 566
- Комментарии ( 2 )
Дамы и господа а также опытные трейдеры,подскажите где можно купить профессионального торг робота скальпера или алгоритм?
- 11 декабря 2016, 08:10
- |
- ответить
- 36 |
- Ответы ( 7 )
The Downtrend In Precious Metals Resumes
- 07 июня 2015, 17:25
- |
Markets began to act sloppy this week…breaking to break below breakdown levels late in the week.
Consequently, I locked in all my gains Thursday…and am now in an all cash position and looking for a little correction.
Unfortunately, Friday saw two of the stocks I sold have stellar days to the upside…and I just watched. I can’t win them all, but the churning action we’ve seen more and more of in the past week makes me happy to have not suffered a single loss, I merely locked in gains.
Churning often leads to moves lower. Moreover, markets are showing failed breakouts. Additionally, June tends to be weak…so I am cautious here.
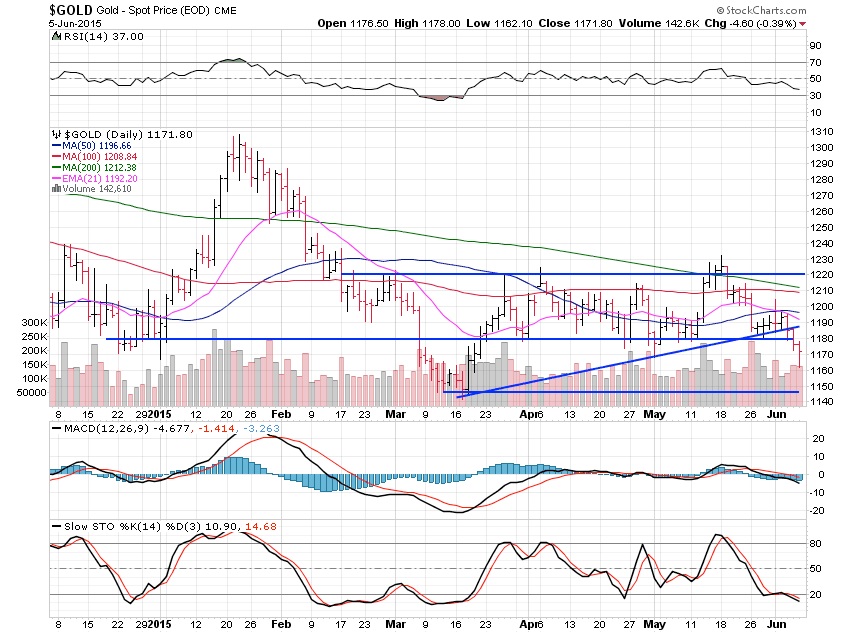
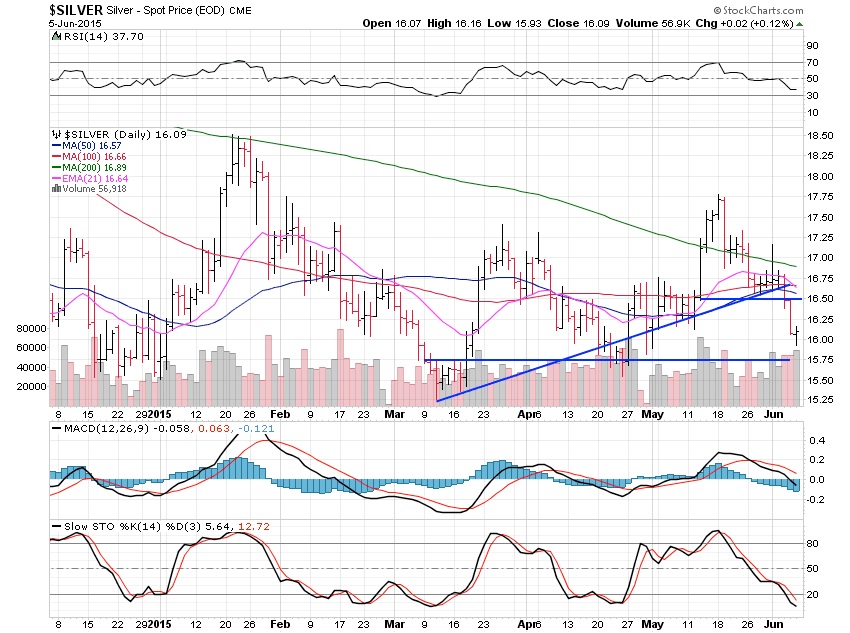
Gold and silver broke below the patterns I showed here last weekend. And now are set for more downside once again. When the metals are breaking a perfect bearish pattern, which says lower, as they are now, all I can hear are the crickets!
Gold lost 1.57% over the past week, which isn’t a lot. Nonetheless, it is breaking the continuation pattern triangle I indicated in this free letter. There really isn’t much else to say.
Gold has support next at $1,150…and then we will see what builds on the charts. Subscribers knew the short level…and many are now short gold and looking to book gains at $1,150.
Charts keep things simple and clean if there is a pattern. To the contrary, there is even less to say.
( Читать дальше )
Старый Графики золота ... Назад в будущее
- 01 июня 2015, 23:15
- |
In this Weekend Report I would like to show you some old charts that we’ve not looked for the most part, in a long time. Some of the long term members may remember some of these charts that go all the way back to when we first opened our doors at Rambus Chartology. When you build long term weekly or monthly charts things change very slowly vs the minute charts. What you were thinking several years or longer ago can still be relative to today’s price action. It lets you know if what you were seeing in the charts back then was way off base or if what you were thinking back then was correct or at least fairly close to what the present day’s price action is showing. It forces you to be honest with yourself.
It’s impossible to catch every little twist and turn the markets make on the short term sharts but the long term view can stay consistent for many years. It’s human nature to try and catch every little wiggle the markets make but in reality the big money is made when you can catch the beginning of a major trend and hold on through thick and thin having the confidence in your charts or whatever trading system you’re using to keep you on the right side of the trend. With that said lets look at some old charts.
This first chart is a combo chart that has the $BPGDM on bottom and GDX on the top. The BPGDM measures the gold stocks that are on a buy signal using a point and figure. First lets look at the bottom right hand side of the chart that shows the BPGDM has been falling for the last several weeks. It topped out at 40 and is currently down to 26. This tells us fewer gold stocks are on buy signals vs two weeks ago which isn’t what you want to see in a strong impulse move up. The BPGDM also has a 5dma and an 8dma that gives short term buy and sell signals. When the price action of the BPGDM falls below the faster 5dma and then the 5dma falls below the 8dma you get a sell signal.
( Читать дальше )
Если доллар уже не король ... Тогда золото придет ему на смену
- 31 мая 2015, 10:28
- |
Как вы читаете последние силы доллара США и его падение обратно после новостей, что ВВП сократилась на 0,7 процента в первом квартале? Классический двойной верх может быть?
Разве сверху доллар в марте с его впечатляющим шип до $ 1,04 за евро с последующим пяти процентов аварии? Это было заключение экспертов HSBC валютных, при условии, что что-то вроде банкротства Греции все еще может подтолкнуть водой евро снова. Так где же валютные спекулянты превратить в следующем торговли импульса?
Все большее число профессиональных финансовых менеджеров думаю, золото будет где розничные игрокам перейти к следующему, и это настоящее золото недавно торговали, как валюты, чем товар. Если доллар больше не король, то золото не выглядит как достойный преемник.
Коррекция делается
( Читать дальше )
что почитать ?
- 08 августа 2014, 22:04
- |


