SMART-LAB
Новый дизайн
Мы делаем деньги на бирже
Блог им. SerSer
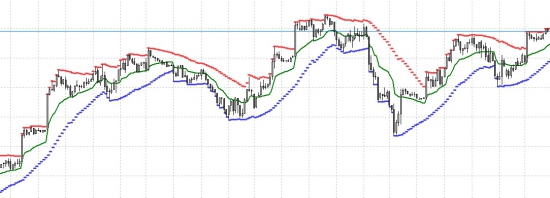
Модификации на тему Price Channel (QUIK LUA)
- 11 июля 2016, 17:05
- |
Может кому нибудь будет интересен модифицированный Price Channel в Квике


Settings =
{
        Name = "xPc5",
        period = 24,
        line=
        {
                {
                        Name = "xPc5",
                        Color = RGB(0, 128, 0),
                        Type = TYPE_LINE,
                        Width = 2
                },

                {
                        Name = "xPc5",
                        Color = RGB(255, 64, 64),
                        Type = TYPET_BAR,
                        Width = 3
                },
                {
                        Name = "xPc5",
                        Color = RGB(64, 64, 255),
                        Type = TYPET_BAR,
                        Width = 3
                }

        }
}

----------------------------------------------------------
function c_FF()


        return function(ind, _p)
                local period = _p
                local index = ind
                local MAX_ = 0
                local MIN_ = 0
                local MAX2_ = 0
                local MIN2_ = 0

                if index == 1 then
                        MAX_ = C(index)
                        MIN_ = C(index)
                        MAX2_ = C(index)
                        MIN2_ = C(index)
                        return nil
                end
----------------------------------------------------------------------
                period = _p
                if index < period then period = index end
                MAX_ = H(index)
                MIN_ = L(index)
                MAX2_ = 0
                MIN2_ = 0
                for i = 0, (period-1) do
                        if MAX_ < H(index-i) then    MAX_ = H(index-i)       end
                        if MIN_ > L(index-i) then    MIN_ = L(index-i)       end
                        MAX2_ = MAX2_ + MAX_
                        MIN2_ = MIN2_ + MIN_
                end
                MAX2_ = MAX2_/(period)
                MIN2_ = MIN2_/(period)
                return (MAX2_+MIN2_)/2, MAX2_, MIN2_
        end
end


function Init()
        myFF = c_FF()
        return 3
end
function OnCalculate(index)
        return myFF(index, Settings.period)
end
727 |
Читайте на SMART-LAB:
ДОМ.РФ обсудит перспективы рынка жилья
Друзья, привет! ⚡️Сегодня наш партнер, ДОМ.РФ, проведет свой первый День инвестора. Компания обсудит финансовые итоги 2025 года и поделится...
14:03

XAU/USD: резкая коррекция сменилась вязкими качелями
Золото за прошедший торговый период частично восстановилось после резкой коррекции, после чего перешло в боковое колебание в ограниченном...
14:50
теги блога Маркин Павел
- Brent
- EUR USD
- Gold
- indicator
- LUA
- micex
- MOEX
- qlua
- quick
- quik
- ri
- rts
- S&P
- si
- treemapping
- usd
- акции
- алгоритм
- алготрейдинг
- аномалия
- АСВ
- банки
- Башнефть
- безграмотность
- биржа
- брокеры
- бюджет
- волатильность
- ВТБ
- Газпром
- голодовка
- дивиденды
- доллар
- звезда
- золото
- инвестор
- Индекс ММВБ
- Индикакаторы
- индикатор
- Инициативы ЦБ
- Карта рынка
- квик
- корреляция
- лидеры падения
- лидеры роста
- лидеры роста и падения ММВБ
- ликвидность
- ЛЧИ 2016
- Минфин
- ММВБ
- Набиуллина
- нетипичные объемы
- нефть
- НЛМК
- новость
- Облигации
- ограничения
- опек+
- опрос
- Опционы
- офз
- оффтоп
- приватизация
- Путин
- Распадская
- рейтинг
- риски
- робоадвайзинг
- роботы
- роснефть
- Россети
- Россия
- рост
- Ростелеком
- ртс
- рубль
- рынки
- рынок
- сарказм
- сбербанк
- Сечин
- смартлаб
- СОФТ
- срочный рынок
- статистика
- тарифы
- тарифы биржи
- тепловая карта
- технический анализ
- торговые сигналы
- трейдинг
- тренд
- Турция
- Улюкаев
- ФОРТС
- ФСК Россети
- ЦБ
- ЦБ России
- шорт
- юмор


1. Откройте текстовый редактор, скопируйте текст программы, сохраните с расширением .lua
2. файл поместите в папку LuaIndicators в корневой папке Квика (если нет такой папки — создайте).
3. после чего кнопка «добавить график» и выберите индикатор
— Код на afl:
per=Param( «Period Max/Min», 14, 1, 200, 1 );
— График:Plot( HHV(H,per),"", colorGreen, styleLine);
Plot( LLV(L,per),"", colorRed, styleLine);
Plot( (HHV(H,per)+LLV(L,per))/2,"", colorBlue, styleLine);
Plot( C, «Close», ColorDefault, GetPriceStyle() );