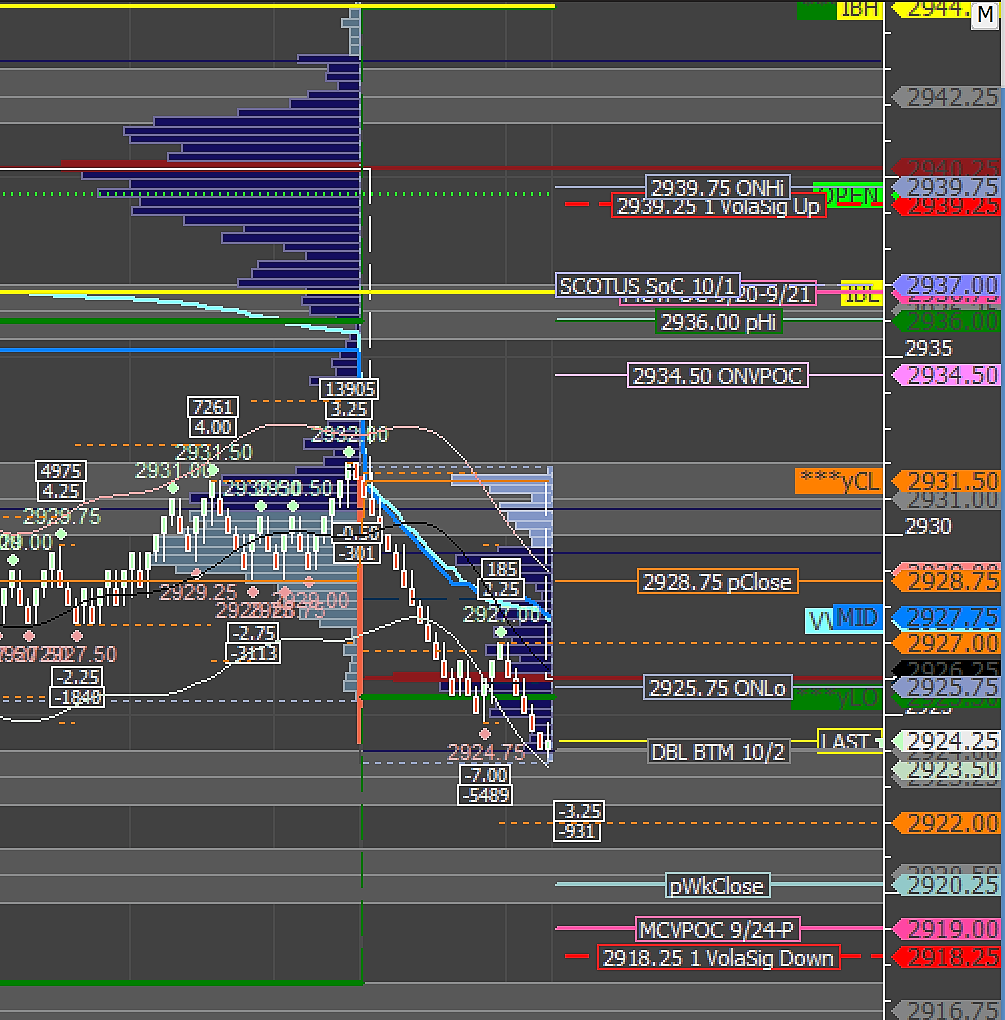
S&P500 фьючерс | SPX
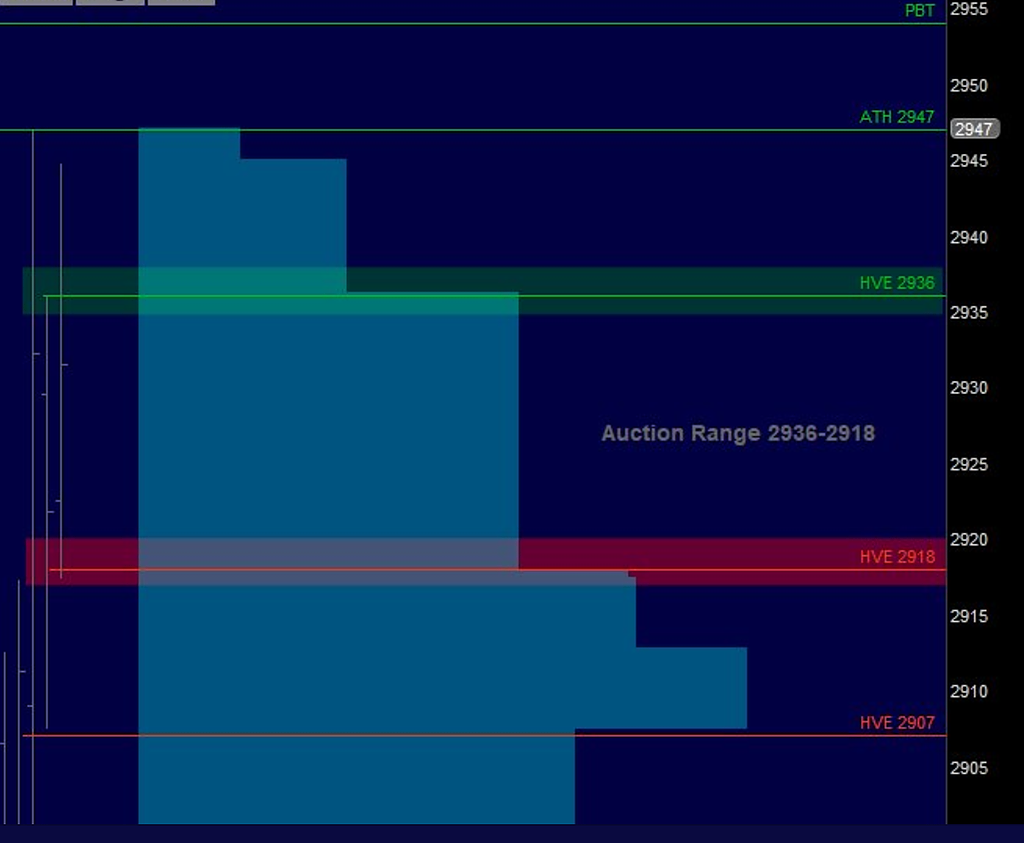


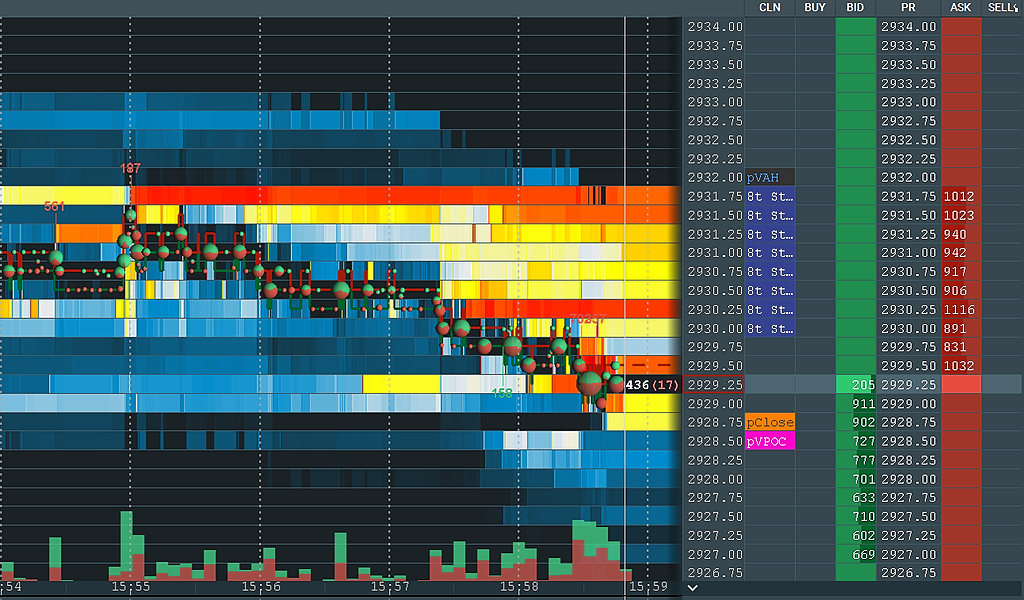


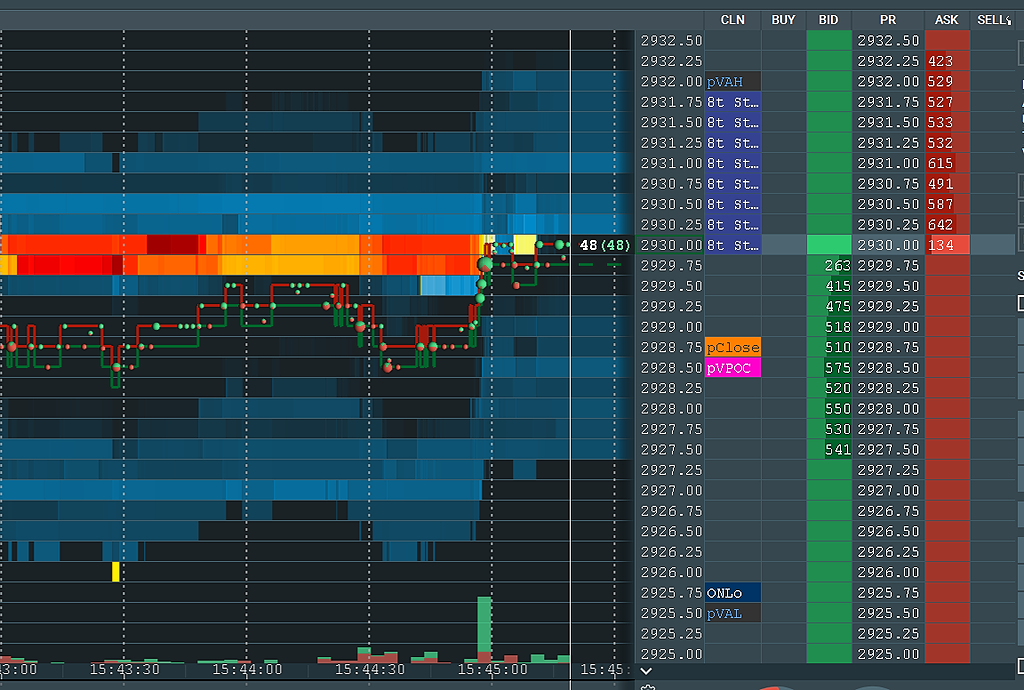


S&P500 фьючерс | SPX
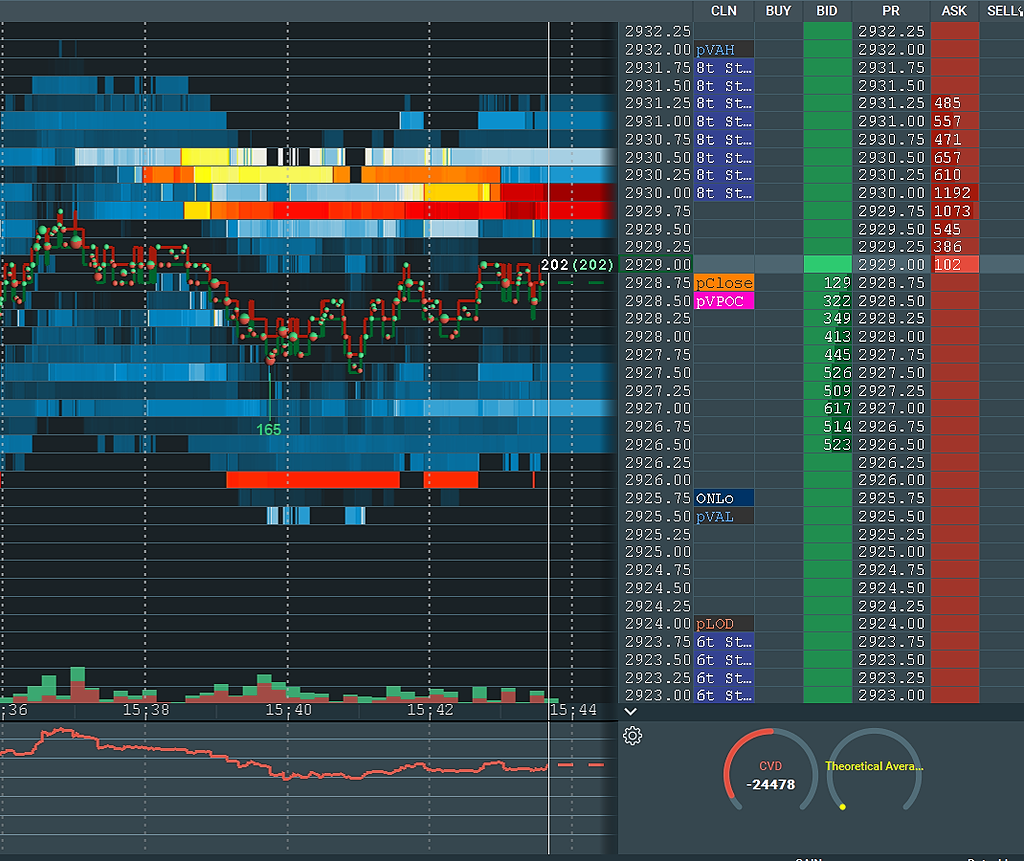
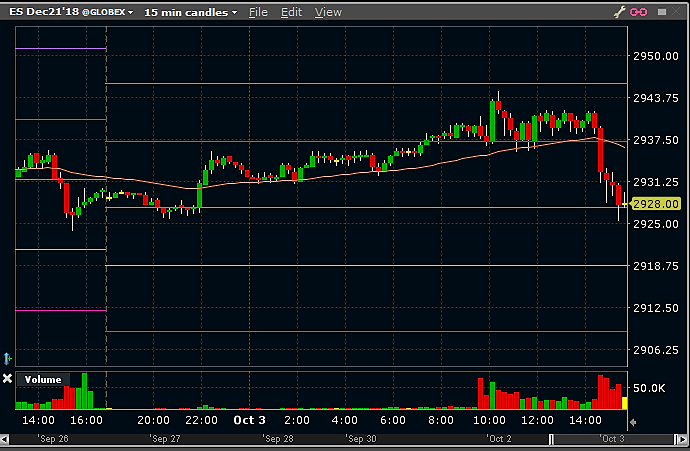
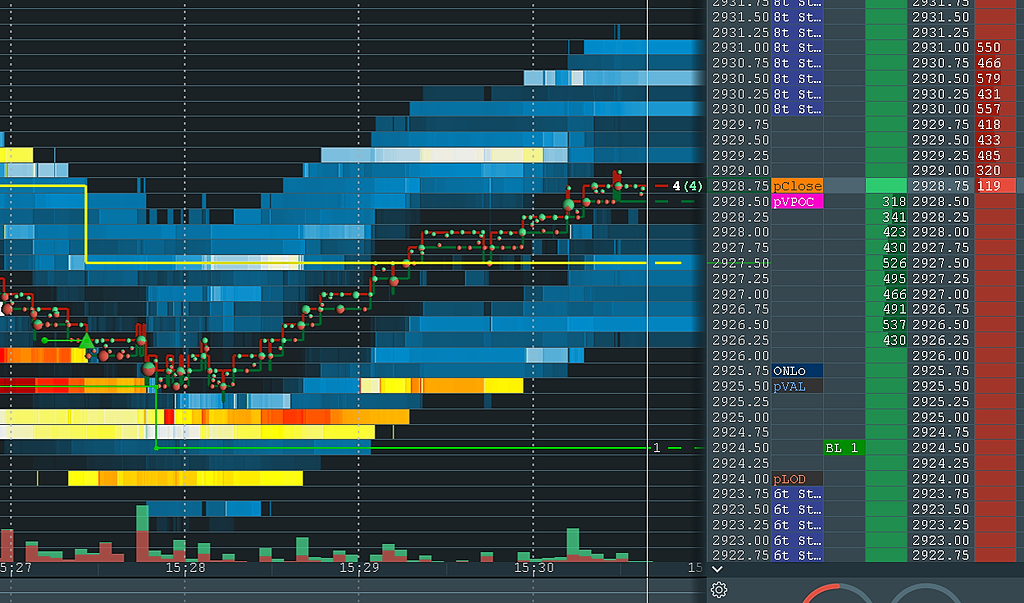
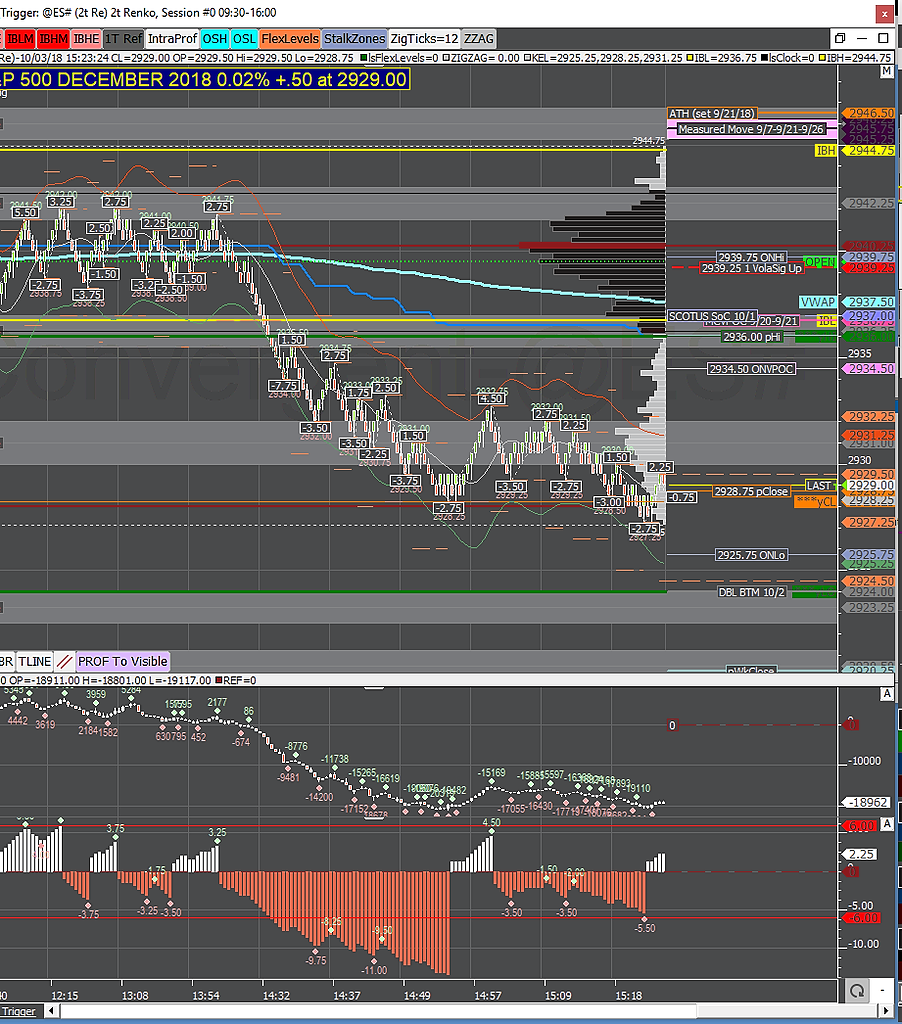
Фьючерс S&P500Торгуется на CME, тикер ES
На Московской бирже есть аналогичный фьючерс US500
Спецификацию и котировки можно найти тут: https://smart-lab.ru/q/futures/ (Ищите наиболее ликвидный символ US)
Чтобы купить акции, выберите надежного брокера:


