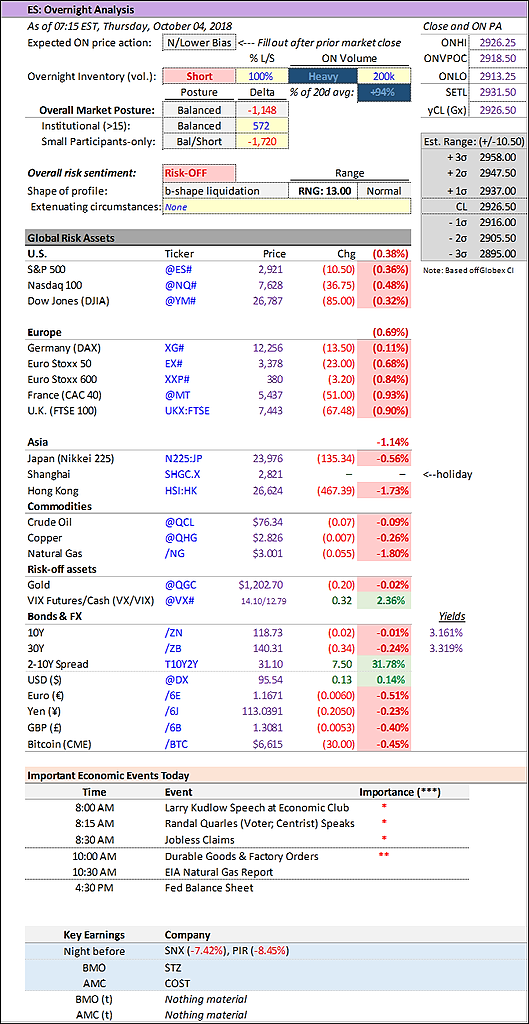
A large rise in U.S. Treasury yields is pulling global bond yields higher across the board and boosted the dollar, while stocks fell in response. The 10-year Treasury note is now at its highest level since mid-2011, up 7 bps to 3.23%, as recent comments from Federal officials signaled more rate hikes are on the horizon. Economic figures pointing to strength in the U.S. economy are also causing markets to reassess how far the Fed's tightening cycle will go.
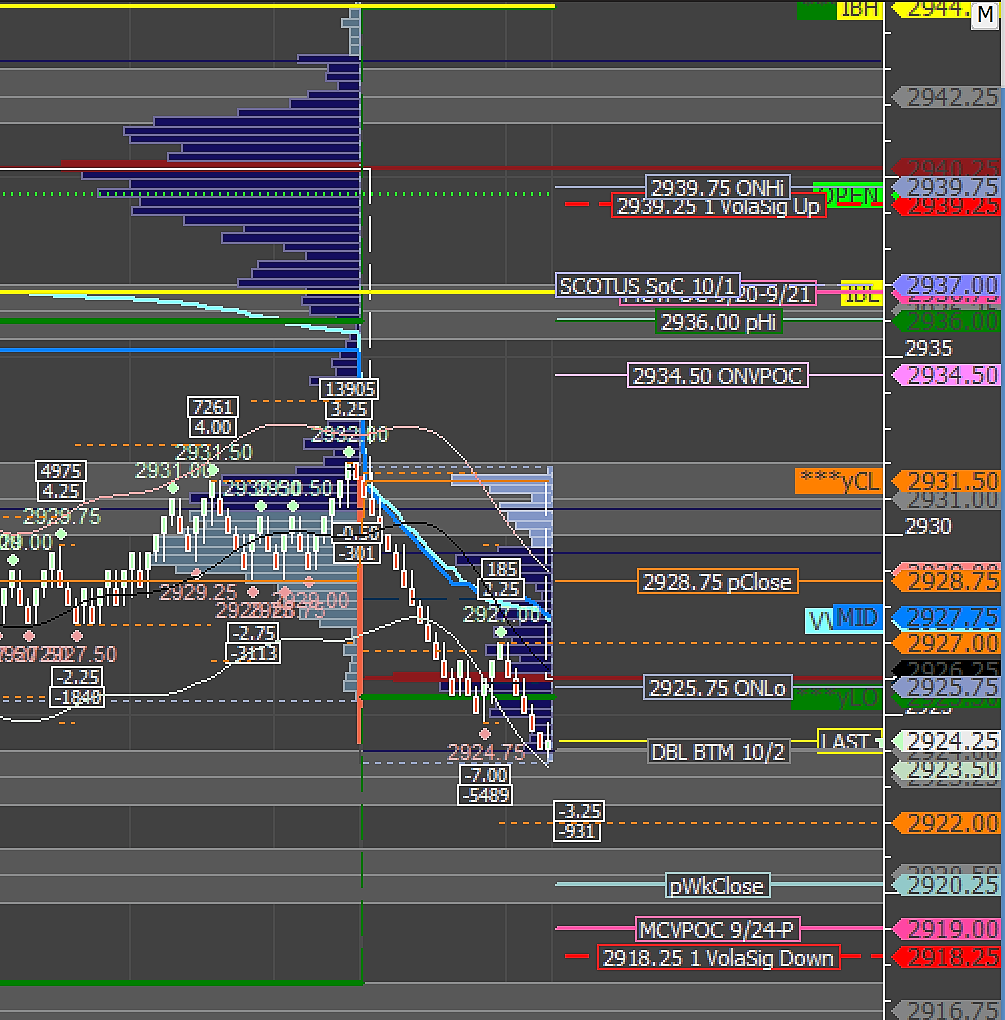
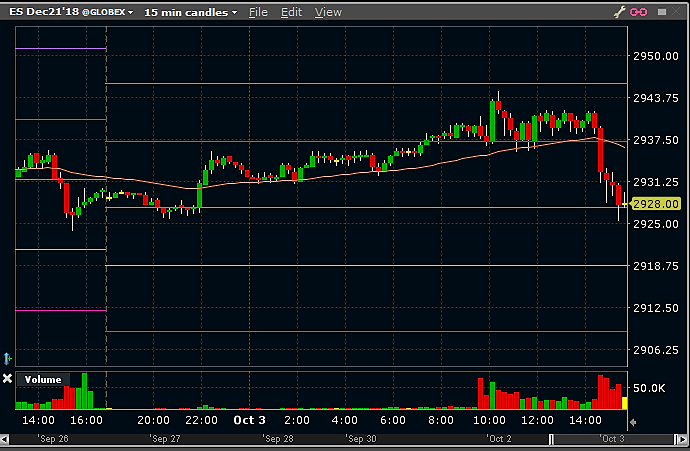
/ESZ8 Value: YVAH 2944 YPOC 2940 YVAL 2931
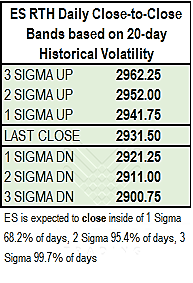
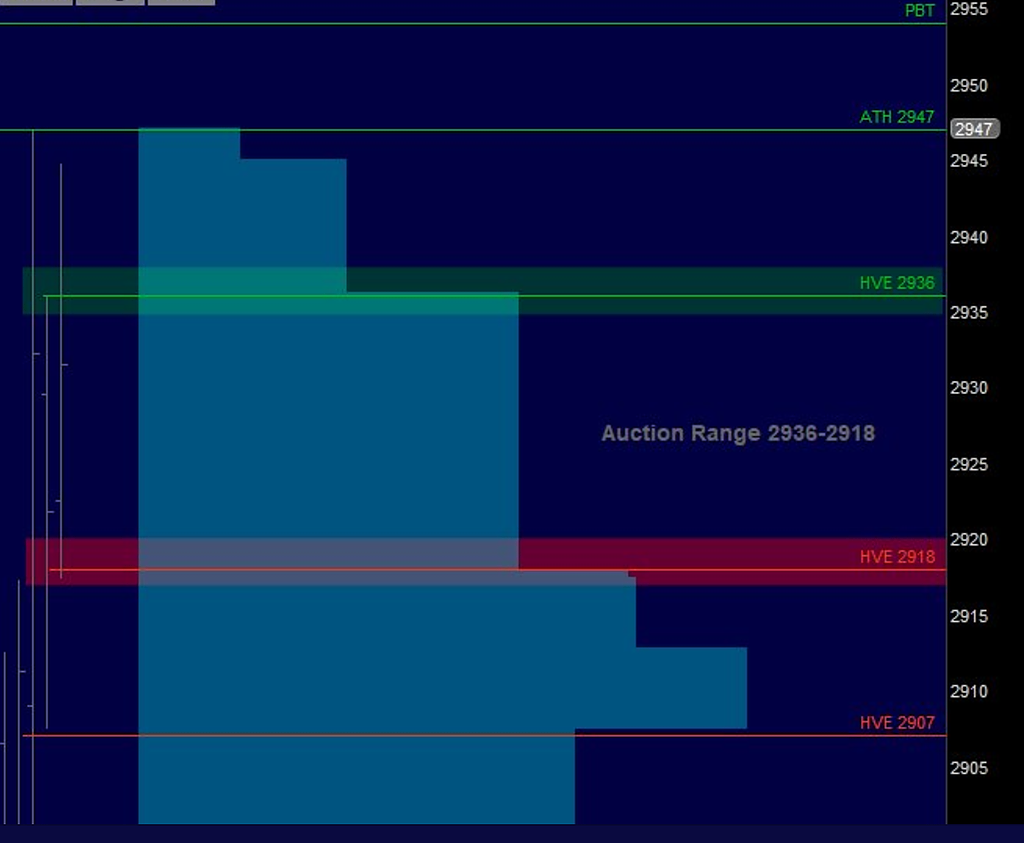
/ES Plan: Yesterday market closed bimodal (LIS 2936) but overnight looks more bearish (GBT 2911), moving below yesterday's range. We're moving into 2918-2936 auction range, so lower edge 2918 will be key, so we've these options:
A) If market remains above HVE 2918 with bullish internals, try to buy towards ONH 2926.25 GAP 2931.50 and HVE 2936.
B) If market starts to move below 2936 with bearish internals, sell towards ONL 2913.25 GAP 2911.75 and HVE 2908.
Today's Economic Calendar
10:00 Factory Orders
10:30 EIA Natural Gas Inventory
S&P500 фьючерс | SPX
-


- This morning's Trader Bite at 16:00 MSK — *9:00 AM* Eastern US:
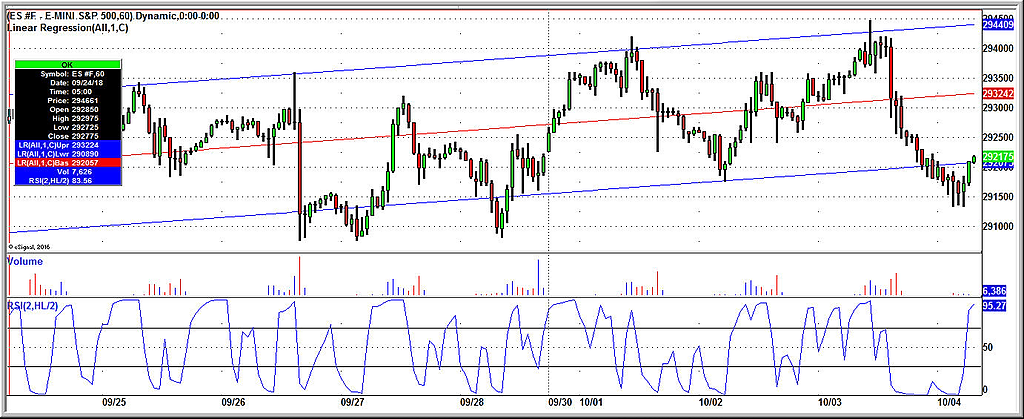
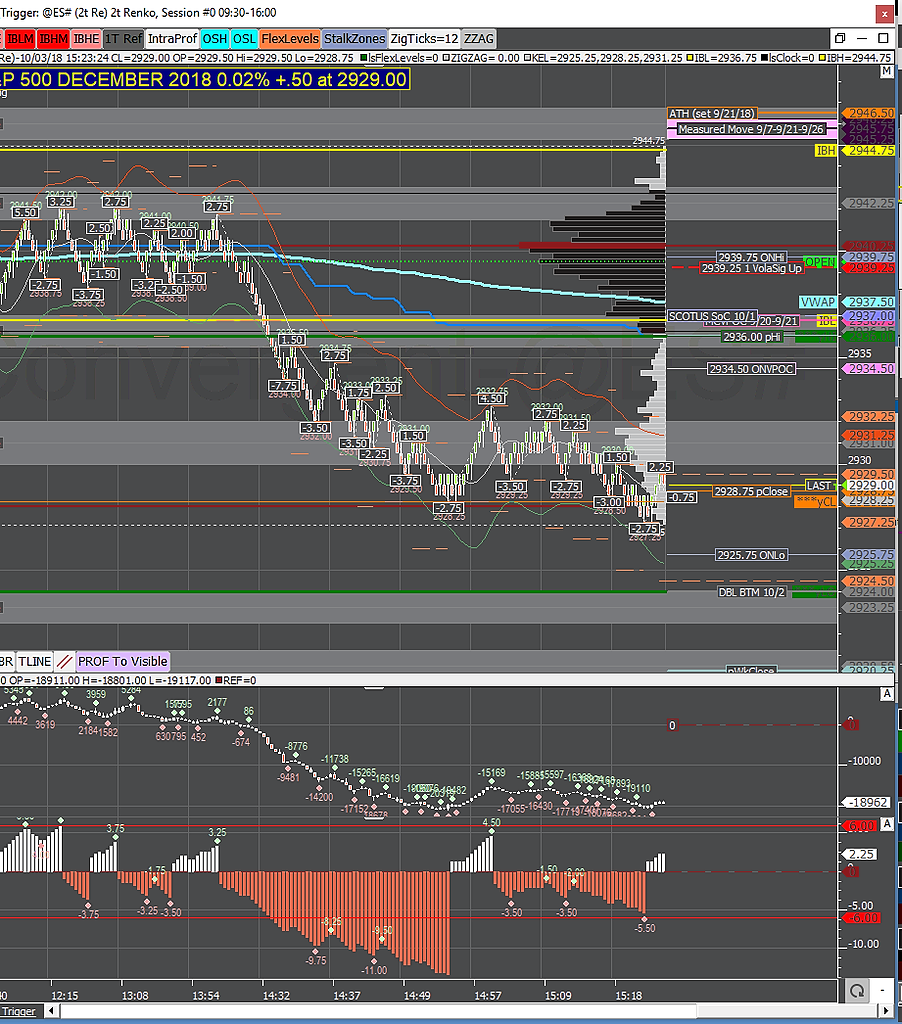
www.youtube.com/watch?v=7V6BlyjbZ1Q - Volume is on the X axis. Below volume is a two-period RSI that is a very short term measure of overbought/oversold. Above volume is a linear regression line (red) with bands of one standard deviation (blue) above and below.
The chart nice illustrates how markets are a joint function of linear trend (the regression line), with one or more cyclical functions overlaid (the movements from upper to lower bands; the movements between short-term overbought and oversold). Notice how often the market will take out a prior low or a previous high, only to cycle back the other way. It's a good illustration of how traders who think primarily in terms of breakouts, momentum, and directional trends get «chopped up» by the market's cyclicality.


S&P500 фьючерс | SPX
Фьючерс S&P500Торгуется на CME, тикер ES
На Московской бирже есть аналогичный фьючерс US500
Спецификацию и котировки можно найти тут: https://smart-lab.ru/q/futures/ (Ищите наиболее ликвидный символ US)
Чтобы купить акции, выберите надежного брокера:


