21 ноября 2021, 01:24
Индикатор целевого роста (версия 3)
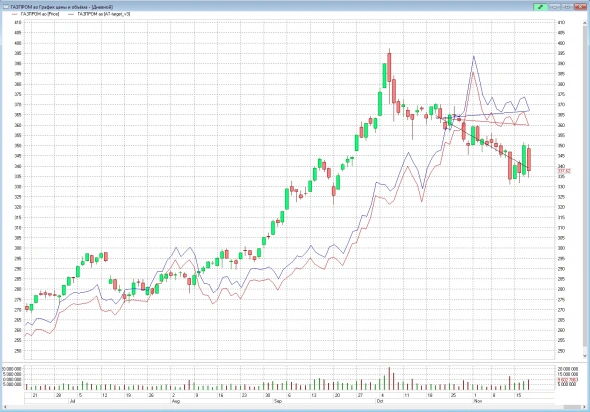
В индикатор AT-target_v3 добавлено отображение целей на истории в виде дополнительных кривых линий


--[[
AutoTrade target indicator
shows target growth/fall
varsion 3
line gr shows real growth
line tgr_up shows target growth
line tgr_dwn shows target fall
line ln_up shows target growth history
line ln_dwn shows target fall history
--]]
Settings=
        {
            Name = "AT-target_v3",   -- indicator name
            per=20,     -- period
			growth=1.0, -- growth by %
			fall=1.0, -- fall by %
			xshift=0, -- shifth by x axis
			showln=1, -- 1-show lines 0-do not show
            line=
                {
                    {
                        Name = "gr",
                        Type =TYPE_LINE,
                        Width = 1,
                        Color = RGB(0,0,0) -- black
                    },
                    {
                        Name = "tgr_up",
                        Type =TYPE_LINE,
                        Width = 1,
                        Color = RGB(0,0,255) -- blue
                    },
                    {
                        Name = "tgr_dwn",
                        Type =TYPE_LINE,
                        Width = 1,
                        Color = RGB(255,0,0) -- red
                    },
                    {
                        Name = "ln_up",
                        Type =TYPE_LINE,
                        Width = 1,
                        Color = RGB(0,0,255) -- blue
                    },
                    {
                        Name = "ln_dwn",
                        Type =TYPE_LINE,
                        Width = 1,
                        Color = RGB(255,0,0) -- red
                    }
                }
       }


function Init()
  return 5
end


function OnCalculate(index)

  sz = Size()
  per = Settings.per
  gr = Settings.growth
  fl = Settings.growth
  sh = Settings.xshift
  sl = Settings.showln

  if index == sz then
    for i = 1, sz do
      -- crearing
      SetValue(i, 1, nil)
	  SetValue(i, 2, nil)
	  SetValue(i, 3, nil)
	  SetValue(i, 4, nil)
	  SetValue(i, 5, nil)
    end
    for i = sz-per-sh, sz-sh do
	  -- paint line
      v = (C(sz-sh) - C(sz-per-sh+1))*(i-(sz-per-sh+1))/per + C(sz-per-sh+1)
	  v2 = (C(sz-per-sh+1)*(1+gr/100) - C(sz-per-sh+1))*(i-(sz-per-sh+1))/per + C(sz-per-sh+1)
	  v3 = -(C(sz-per-sh+1)*(1+fl/100) - C(sz-per-sh+1))*(i-(sz-per-sh+1))/per + C(sz-per-sh+1)
      SetValue(i, 1, v)
	  SetValue(i, 2, v2)
	  SetValue(i, 3, v3)
    end
    if sl == 1 then
      for i = per, sz-sh do
	    -- paint line
	    v4 = (C(i-per+1)*(1+gr/100) - C(i-per+1)) + C(i-per+1)
	    v5 = -(C(i-per+1)*(1+fl/100) - C(i-per+1)) + C(i-per+1)
	    SetValue(i, 4, v4)
	    SetValue(i, 5, v5)
      end
	end
	-- last value
	if sh == 0 then
	  return v, v2, v3, v4, v5
	end
  end

end
2 Комментария
 Просто Егор21 ноября 2021, 01:27это кривые минимума и максимума, смещенные на какой-то шаг вперед? или есть еще что-нибудь?0
Читайте на SMART-LAB:

Аренадата чудом выполнила гайденс. Сравнение с сектором по мультипликаторам. Прогноз результатов и дивидендов за 2025 год.
Вчера Аренадата опубликовала пресс-релиз . За 2 дня после выхода новостей акции росли максимально до +28%.
Фокус пресс-релиза не на результате, а на том, что компания выполнила гайденс. Сам...
17:36

USD/JPY: в фокусе — борьба за ключевую область
Валютная пара подходит к важной точке пересечения нескольких технических линий: пробитого недельного пологого даунтренда (построенного по максимумам 10.07.2024 и 10.01.2025), уровня поддержки...
20:14


