И ещё много на английском
Лучше смотреть в источнике, там более читабельно
www.bat-science.com/group/sites/UK__9D9KCY.nsf/vwPagesWebLive/DOBELLYE
Key performance indicators — summary
Total cigarette and THP volume declined in line with the industry*, down 3.5% to 336 billion sticks. In the key markets, value share1 increased 10 bps while volume share2 was in line with 2018;
Strategic Cigarette and THP increased volume share by 60 bps driven by the continued growth of Rothmans and success of Neo, with Strategic Cigarette and THP volume down only 0.5%;
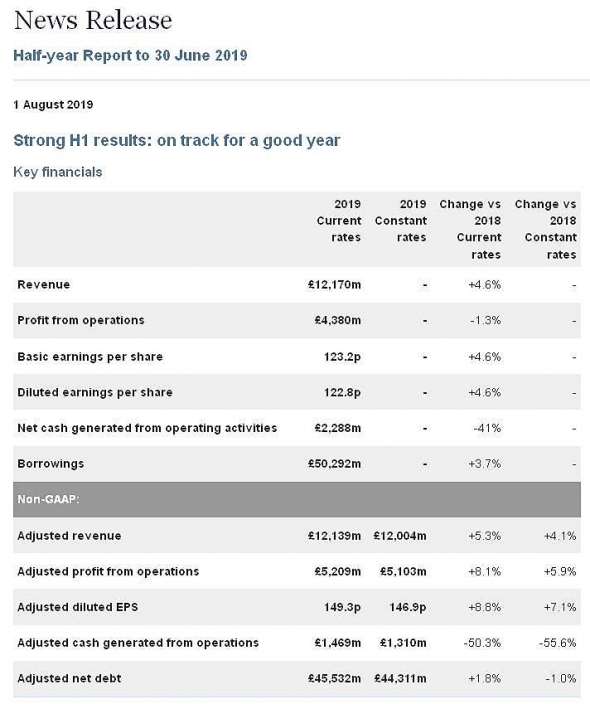
Revenue increased 4.6% to £12,170 million, as good price/mix (totalling 7%) across the cigarette portfolio, as well as growth in revenue from New Categories and Traditional Oral, more than offset lower cigarette volume. The foreign exchange impact was a tailwind of 1.2% on our reported results. On a constant currency basis and excluding the impact of excise on bought in goods, adjusted revenue^ increased by 4.1%;
Revenue from the Strategic Portfolio (defined on page 80 of the full announcement) was up 8.7%, or 6.6% on an adjusted constant rate basis, with the growth driven (at constant rates) by:
5.2% growth in revenue from the strategic combustible brands;
27% increase in revenue from New Categories to £531 million, with volume growth across all categories:
THP revenue up 4% to £301 million, with consumable volume up 17% to 3.9 billion sticks, driven by Japan, South Korea and Russia;
Vapour revenue up 58% to £183 million, with consumables volume increasing 32% to 102 million units, with volume higher across ENA and Canada; and
Modern oral revenue up 284% to £47 million, with volume 179% higher (to 412 million pouches) driven by Scandinavia and Russia; and
10% increase in revenue from traditional oral to £463 million with volume in line with 2018;
Profit from operations was down 1.3%, as the strong operational performance, which included a translational foreign exchange tailwind of 2.2%, was more than offset by the £436 million charge recognised in Canada related to the Quebec Class Action. Consequently, operating margin declined 210 bps;
Adjusted profit from operations grew 5.9% at constant rates of exchange as the adjusted revenue growth and continued drive for efficiency gains (including the product rationalisation to remove complexity) more than offset the increased investment in New Categories that reflects the Group’s continued development of these categories;
Adjusted operating margin, at current rates, was 110 bps higher than the same period in 2018 at 42.9%, as the investment in the development and roll out of New Categories was more than offset by pricing and cost control;
Net cash generated from operating activities fell by 41% to £2,288 million, with cash conversion of 52% (compared to 87% in the same period last year) due to the timing of payments related to the master settlement agreement (MSA) in prior periods described on page 36, and working capital movements. Operating cash flow conversion of 66% (30 June 2018: 70% after normalising for the timing of the MSA payment). The decrease in conversion, on a normalised basis, was largely due to the working capital movements in the period;
Borrowings increased to £50,292 million (30 June 2018: £48,512 million, 31 December 2018: £47,509 million), driven by the timing of cash generation, working capital movements and the recognition of lease liabilities under IFRS 16 (£607 million);
Adjusted net debt3 increased to £45,532 million (30 June 2018: £44,739 million, 31 December 2018: £43,407 million). This was driven by the recognition of lease liabilities under IFRS 16 (£607 million) and free cash outflow (after dividends paid to shareholders) of £1,052 million (30 June 2018: £611 million inflow). The movement in free cash flow after dividends paid to shareholders against 2018 was due to the short-term timing impact of working capital movements and the payments related to the MSA. With the normal weighting of cash generation to the second half of the year, the Group continues to expect to generate free cash flow after dividends in excess of £1.5 billion for the full year. Adjusted net debt to adjusted EBITDA is expected to reduce by approximately 0.4x in 2019, excluding the translational foreign exchange impact;
Basic earnings per share increased 4.6%, with diluted earnings per share 4.6% higher, as a reduction in the effective tax rate from 30.1% to 25.1% and an improved performance from the Group’s main associate in India (ITC) more than offset the lower profit from operations explained above; and
Adjusted diluted earnings per share at constant rates of exchange rose 7.1%, as the Group’s growth in adjusted profit from operations, an improved performance from ITC and a decrease in the underlying effective tax rate from 26.9% to 26.6% more than offset a £55 million increase in adjusted net finance costs.


