THIS DATA SERIES WAS UPDATED SEPTEMBER 21 IN ORDER TO ELIMINATE STALE SERIES AND ADD MORE ROBUST ONES. ALL HISTORICAL DATA HAS BEEN UPDATED.
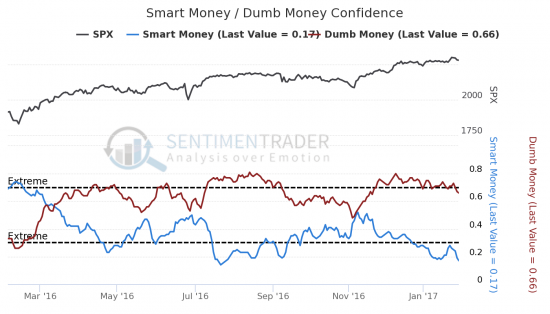
The Smart Money Confidence and Dumb Money Confidence indices are a unique innovation that allows subscribers to see, in one quick glance, what the «good» market timers are doing with their money compared to what «bad» market timers are doing.
Our Confidence indices use mostly real-money gauges — there are few opinions involved here. Generally, we want to follow the Smart Money traders when they reach an extreme — we want to bet on a market rally when they are confident of rising prices, and we want to be short (or in cash) when they are expecting a market decline. The higher the confidence number, the more aggressively we should be looking for higher prices.
Examples of some Smart Money indicators include the OEX put/call and open interest ratios, commercial hedger positions in the equity index futures, and the current relationship between stocks and bonds.
In contrast to the Smart Money, we want to do the opposite of what the Dumb Money is doing when they are at an extreme. These traders have proven themselves over history to be bad at market timing. They get very bullish after a market rally, and bearish after a market fall. By the time the majority of them catch on to a trend, it?s too late — the trend is about to reverse. It tells us how confident we should be in selling the market.
Examples of some Dumb Money indicators include the equity-only put/call ratio, the flow into and out of the Rydex series of index mutual funds, and small speculators in equity index futures contracts. We also chart the spread between the Smart Money and Dumb Money. This gives us a quick view of the difference between the two groups of traders. Because the «dumb money» follows trends, and the «smart money» generally goes against trends, the «dumb money» is usually correct during the meat of the trend. So when the Dumb Money Confidence is higher than the Smart Money Confidence, that means sentiment is positive.
When it becomes too positive, however, then sentiment has reached an extreme, and stocks often run into trouble. This usually happens because the Dumb Money rises above 60%, and the Smart Money drops below 40%. That is a warning sign for stocks.
When the Dumb Money is below the Smart Money, then sentiment is negative and stocks are usually struggling. It's best to be defensive at times like this. However, when sentiment becomes too negative, then stocks are often poised to rally over the next 1-3 months. This usually occurs because the Dumb Money has dropped below 40% and the Smart Money has risen above 60%.
What is considered «smart» is simply based on an indicator's historical record at extremes. If an indicator is usually showing excessive pessimism near a market peak, and excessive optimism near a market bottom, then that indicator will be included in our Smart Money calculation. And if it consistently shows too much pessimism near a low and too much optimism near a high, it will be considered Dumb Money.
Confidence indices are presented on a scale of 0% to 100%. When the Smart Money Confidence is at 100%, it means that those most correct on market direction are 100% confident of a rising market?and we want to be right alongside them. When it is at 0%, it means that these good market timers are 0% confident in a rally, and we want to be in cash or even short when confidence is very low.
We can use the Dumb Money Confidence in a similar, but opposite, manner. For example, if the Dumb Money Confidence is at 100%, then that means that these bad market timers are supremely confident in a market rally. And history suggests that when these traders are confident, we should be very, very worried that the market is about to decline. When the Dumb Money Confidence is at 0%, then from a contrary perspective we should be concentrating on the long side, expecting these traders to be wrong again and the market to rally.
In practice, our Confidence Indexes rarely get below 30% or above 70%.
О'кей продает гипермаркеты, котировки улетают в космос
Окей продает бизнес гипермаркетов менеджменту, котировки расписок взлетели на 20%. Компания сообщила, что после завершения в Группе остан...
Вообще отправлять еще не проданный газ — это лучшие газпромовские практики, там компания побогаче правда, поэтому сразу триллионы тратила на трубы без объемов, тут все скромнее.
ALB, А оценка активов в 49 млрд рублей случайно не тогда образовалась, когда аффилированные оценщики оценили активы в качестве залога для открытия кредитной линии под ввод нового ТЦ.
И по поводу ...
Про Сахалин в Газпроме скромно умалчивают. А там достижения просто невероятные!
Ребята умудряются второй год снижать производство при росте спроса в Азии, при этом имея сверхкороткое транспортное пл...
Владислав, часть плеча по плавающей ставке. Возможны ковенанты по кредитному договору. Например, обязательство резервировать под скачок КС на 500бп на квартал вперёд.
YgrOK, это хорошо. Конструктивная критика всегда есть гуд. Даже если оная идёт вразрез с моими хотелками — всё равно респект.
Добавлю, что допка не гарантирует спуск цены вниз. У РКК Энергия т...
Construction:
THIS DATA SERIES WAS UPDATED SEPTEMBER 21 IN ORDER TO ELIMINATE STALE SERIES AND ADD MORE ROBUST ONES. ALL HISTORICAL DATA HAS BEEN UPDATED.
The Smart Money Confidence and Dumb Money Confidence indices are a unique innovation that allows subscribers to see, in one quick glance, what the «good» market timers are doing with their money compared to what «bad» market timers are doing.
Our Confidence indices use mostly real-money gauges — there are few opinions involved here. Generally, we want to follow the Smart Money traders when they reach an extreme — we want to bet on a market rally when they are confident of rising prices, and we want to be short (or in cash) when they are expecting a market decline. The higher the confidence number, the more aggressively we should be looking for higher prices.
Examples of some Smart Money indicators include the OEX put/call and open interest ratios, commercial hedger positions in the equity index futures, and the current relationship between stocks and bonds.
In contrast to the Smart Money, we want to do the opposite of what the Dumb Money is doing when they are at an extreme. These traders have proven themselves over history to be bad at market timing. They get very bullish after a market rally, and bearish after a market fall. By the time the majority of them catch on to a trend, it?s too late — the trend is about to reverse. It tells us how confident we should be in selling the market.
Examples of some Dumb Money indicators include the equity-only put/call ratio, the flow into and out of the Rydex series of index mutual funds, and small speculators in equity index futures contracts. We also chart the spread between the Smart Money and Dumb Money. This gives us a quick view of the difference between the two groups of traders. Because the «dumb money» follows trends, and the «smart money» generally goes against trends, the «dumb money» is usually correct during the meat of the trend. So when the Dumb Money Confidence is higher than the Smart Money Confidence, that means sentiment is positive.
When it becomes too positive, however, then sentiment has reached an extreme, and stocks often run into trouble. This usually happens because the Dumb Money rises above 60%, and the Smart Money drops below 40%. That is a warning sign for stocks.
When the Dumb Money is below the Smart Money, then sentiment is negative and stocks are usually struggling. It's best to be defensive at times like this. However, when sentiment becomes too negative, then stocks are often poised to rally over the next 1-3 months. This usually occurs because the Dumb Money has dropped below 40% and the Smart Money has risen above 60%.
What is considered «smart» is simply based on an indicator's historical record at extremes. If an indicator is usually showing excessive pessimism near a market peak, and excessive optimism near a market bottom, then that indicator will be included in our Smart Money calculation. And if it consistently shows too much pessimism near a low and too much optimism near a high, it will be considered Dumb Money.
Confidence indices are presented on a scale of 0% to 100%. When the Smart Money Confidence is at 100%, it means that those most correct on market direction are 100% confident of a rising market?and we want to be right alongside them. When it is at 0%, it means that these good market timers are 0% confident in a rally, and we want to be in cash or even short when confidence is very low.
We can use the Dumb Money Confidence in a similar, but opposite, manner. For example, if the Dumb Money Confidence is at 100%, then that means that these bad market timers are supremely confident in a market rally. And history suggests that when these traders are confident, we should be very, very worried that the market is about to decline. When the Dumb Money Confidence is at 0%, then from a contrary perspective we should be concentrating on the long side, expecting these traders to be wrong again and the market to rally.
In practice, our Confidence Indexes rarely get below 30% or above 70%.