07 сентября 2011, 19:47
Понравилось мнение по поводу возможного роста Индекса доллара.
The entire concept of charting is based on the premise that geometric configurations tend to repeat themselves — of course, with slightly different variations.
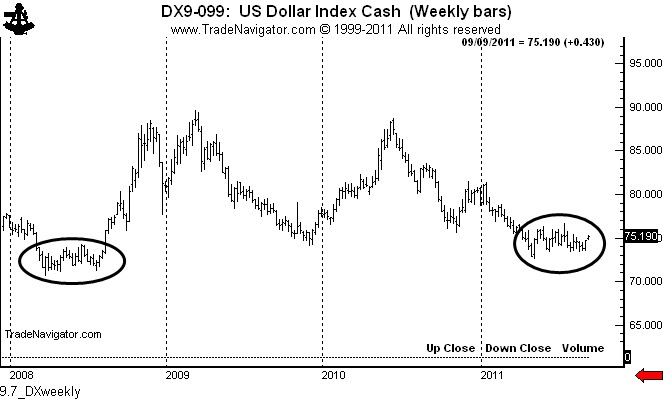
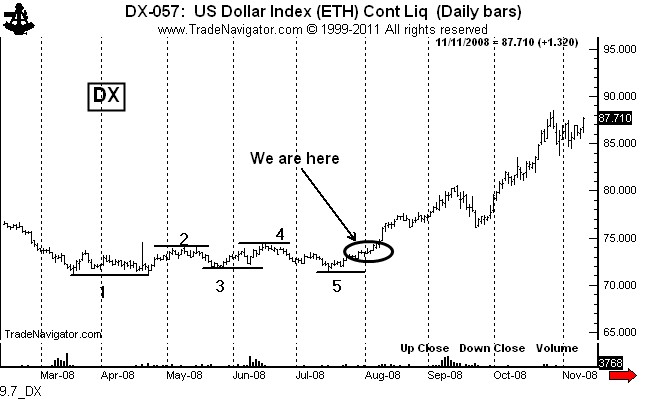
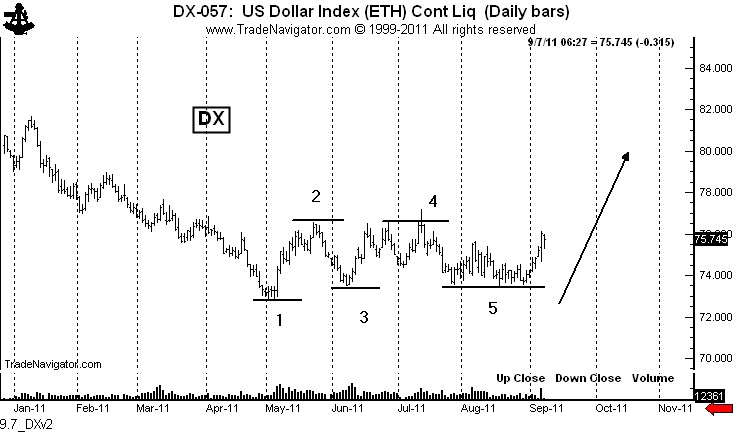
There is evidence that the U.S. Dollar is bottoming. In fact, the current 4-month bottom in the US$ is almost identical to the 5-month bottom in 2008.
Below find three charts:


There is evidence that the U.S. Dollar is bottoming. In fact, the current 4-month bottom in the US$ is almost identical to the 5-month bottom in 2008.
Below find three charts:
- The weekly graph, showing the 2008 bottom and the possible bottom at hand.
- The daily chart from 2008, showing five points of demarcation.
- The daily chart today, showing the same five points.


1 Комментарий
 Romson07 сентября 2011, 20:10Да, есть такое ощущение, что давненько DXY в район 85 не заглядывал. Как то в этом году коррекции стоков проходят без выраженного укрепления бакса.0


