18 марта 2019, 23:01
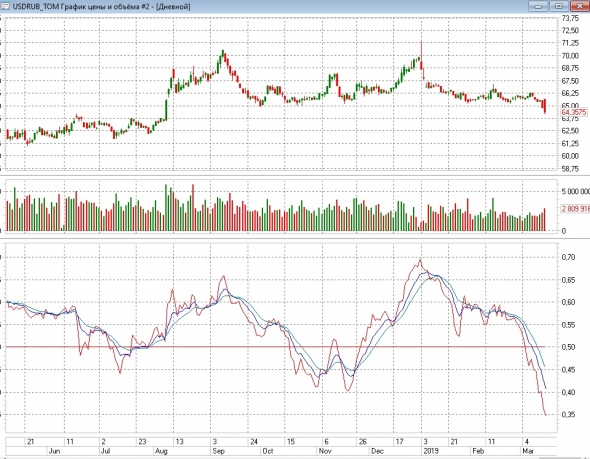
Доработал индикатор STATDIV на lua для quik
пользоваться можно так:
если касная кривая выше 0,5 и синяя выше зеленой то логуем
если красная ниже 0,5 и синяя ниже зеленой то шортим
принимаю пожелания по изменению кода индикатора

скачать можно здесь:
dropmefiles.com/y4kpv
как установить:
в папке quik создаете папку LuaIndicators туда кидаете текстовый файл с раcширением .lua и содержанием приведенного индикатора, потом запускаете quik и добавляете как обычный индикатор к графику с именем STATDIV
продолжение темы: smart-lab.ru/blog/528145.php
код:
Settings={
Name=«STATDIV»,
period=25,
line=
{
{
Name=«curve»,
Color=RGB(255,0,0),
Type=TYPE_LINE,
Width=1
},
{
Name=«line»,
Color=RGB(255,0,0),
Type=TYPE_LINE,
Width=1
},
{
Name=«MA»,
Color=RGB(0,0,255),
Type=TYPE_LINE,
Width=1
},
{
Name=«MA2»,
Color=RGB(0,128,128),
Type=TYPE_LINE,
Width=1
}
}
}
function Init()
cache_ind={}
cache_ind2={}
return 4
end
function OnCalculate(index)
if index < Settings.period then
return nil
else
local sum1=0
local sum2=0
local sum0=0
local sum02=0
for i=index-Settings.period+1, index do
do
if C(i) > O(i) then
sum1 = sum1 + C(i) — O(i)
sum2 = sum2 + C(i) — O(i)
else
sum2 = sum2 + O(i) — C(i)
end
end
cache_ind[index] = sum1/sum2
if index > Settings.period+12 then
sum0 = 1*cache_ind[index]+
(1/2)*cache_ind[index-1]+
(1/3)*cache_ind[index-2]+
(1/4)*cache_ind[index-3]+
(1/5)*cache_ind[index-4]+
(1/6)*cache_ind[index-5]+
(1/7)*cache_ind[index-6]+
(1/8)*cache_ind[index-7]+
(1/9)*cache_ind[index-8]+
(1/10)*cache_ind[index-9]+
(1/11)*cache_ind[index-10]+
(1/12)*cache_ind[index-11]+
(1/13)*cache_ind[index-12]
end
sum0 = sum0/(1+1/2+1/3+1/4+1/5+1/6+1/7+1/8+1/9+1/10+1/11+1/12+1/13)
cache_ind2[index] = sum0
if index > Settings.period+24 then
sum02 = 1*cache_ind2[index]+
(1/2)*cache_ind2[index-1]+
(1/3)*cache_ind2[index-2]+
(1/4)*cache_ind2[index-3]+
(1/5)*cache_ind2[index-4]+
(1/6)*cache_ind2[index-5]+
(1/7)*cache_ind2[index-6]+
(1/8)*cache_ind2[index-7]+
(1/9)*cache_ind2[index-8]+
(1/10)*cache_ind2[index-9]+
(1/11)*cache_ind2[index-10]+
(1/12)*cache_ind2[index-11]+
(1/13)*cache_ind2[index-12]
end
sum02 = sum02/(1+1/2+1/3+1/4+1/5+1/6+1/7+1/8+1/9+1/10+1/11+1/12+1/13)
end
return sum1/sum2, 0.5, sum0, sum02
end
end
всем удачи!
если касная кривая выше 0,5 и синяя выше зеленой то логуем
если красная ниже 0,5 и синяя ниже зеленой то шортим
принимаю пожелания по изменению кода индикатора

скачать можно здесь:
dropmefiles.com/y4kpv
как установить:
в папке quik создаете папку LuaIndicators туда кидаете текстовый файл с раcширением .lua и содержанием приведенного индикатора, потом запускаете quik и добавляете как обычный индикатор к графику с именем STATDIV
продолжение темы: smart-lab.ru/blog/528145.php
код:
Settings={
Name=«STATDIV»,
period=25,
line=
{
{
Name=«curve»,
Color=RGB(255,0,0),
Type=TYPE_LINE,
Width=1
},
{
Name=«line»,
Color=RGB(255,0,0),
Type=TYPE_LINE,
Width=1
},
{
Name=«MA»,
Color=RGB(0,0,255),
Type=TYPE_LINE,
Width=1
},
{
Name=«MA2»,
Color=RGB(0,128,128),
Type=TYPE_LINE,
Width=1
}
}
}
function Init()
cache_ind={}
cache_ind2={}
return 4
end
function OnCalculate(index)
if index < Settings.period then
return nil
else
local sum1=0
local sum2=0
local sum0=0
local sum02=0
for i=index-Settings.period+1, index do
do
if C(i) > O(i) then
sum1 = sum1 + C(i) — O(i)
sum2 = sum2 + C(i) — O(i)
else
sum2 = sum2 + O(i) — C(i)
end
end
cache_ind[index] = sum1/sum2
if index > Settings.period+12 then
sum0 = 1*cache_ind[index]+
(1/2)*cache_ind[index-1]+
(1/3)*cache_ind[index-2]+
(1/4)*cache_ind[index-3]+
(1/5)*cache_ind[index-4]+
(1/6)*cache_ind[index-5]+
(1/7)*cache_ind[index-6]+
(1/8)*cache_ind[index-7]+
(1/9)*cache_ind[index-8]+
(1/10)*cache_ind[index-9]+
(1/11)*cache_ind[index-10]+
(1/12)*cache_ind[index-11]+
(1/13)*cache_ind[index-12]
end
sum0 = sum0/(1+1/2+1/3+1/4+1/5+1/6+1/7+1/8+1/9+1/10+1/11+1/12+1/13)
cache_ind2[index] = sum0
if index > Settings.period+24 then
sum02 = 1*cache_ind2[index]+
(1/2)*cache_ind2[index-1]+
(1/3)*cache_ind2[index-2]+
(1/4)*cache_ind2[index-3]+
(1/5)*cache_ind2[index-4]+
(1/6)*cache_ind2[index-5]+
(1/7)*cache_ind2[index-6]+
(1/8)*cache_ind2[index-7]+
(1/9)*cache_ind2[index-8]+
(1/10)*cache_ind2[index-9]+
(1/11)*cache_ind2[index-10]+
(1/12)*cache_ind2[index-11]+
(1/13)*cache_ind2[index-12]
end
sum02 = sum02/(1+1/2+1/3+1/4+1/5+1/6+1/7+1/8+1/9+1/10+1/11+1/12+1/13)
end
return sum1/sum2, 0.5, sum0, sum02
end
end
всем удачи!
42 Комментария
 Mike Dewar18 марта 2019, 23:51Нормалайзер!)+1
 Technotrade19 марта 2019, 00:02Это что грааль ?0
 Rostislav Kudryashov19 марта 2019, 00:11И каковы результаты тестирования на истории котировок за последние 10 лет ММВБ И ФОРТСа?0
 Константин19 марта 2019, 00:29autotrade.ru, при чем фильтр запаздывающий и чаще идущий в противофазе к движениям0
Читайте на SMART-LAB:
Самолет лидер по объему ввода жилья в МО
Друзья, привет! Продолжаем делиться своими результатами. 🚀 По данным Главстройнадзора МО , мы стали лидером по объемам ввода жилья в Подмосковье в 2025 году! Всего за год в Московской...
20.02.2026
Инвестиции без спешки: торгуем в выходные
Рынок часто движется импульсами, и тем важнее оценивать активы без спешки, не отвлекаясь на инфошум. Для этого отлично подходят выходные дни. В конце недели разбираем самые заметные события и...
20.02.2026

Как инвестирует Ярослав Кабаков
Поговорили с директором по стратегии ФГ «Финам» Ярославом Кабаковым — обсудили вредные инвестпривычки, выбор стратегии, использование ИИ и профессиональную интуицию. Делимся самыми...
20.02.2026

Россети Ленэнерго. Отчет об исполнении инвестпрограммы за Q4 2025г. Опасения оправдались - обесценение съело прибыль
Компания Россети Ленэнерго опубликовала отчет об исполнении инвестпрограммы за Q4 2025г., где показаны финансовые показатели компании по РСБУ в 4 квартале (ну и понятно за целый год):...
20.02.2026


